Vol. 11, No. 5 / Number, Wages, Salaries, and Earnings, and Socioeconomic Characteristics of Seafood Processing Workers and Owners
Abstract
In this issue, Dr. Posadas shows the long-term trends in the number, wages, salaries, and earnings of workers and owners of seafood processing plants in the U.S. and Gulf of Mexico states since 2001. He compared the socioeconomic characteristics of the workers and owners in 2016 and 2020.
Most Valued Gulf Processed Seafood Products
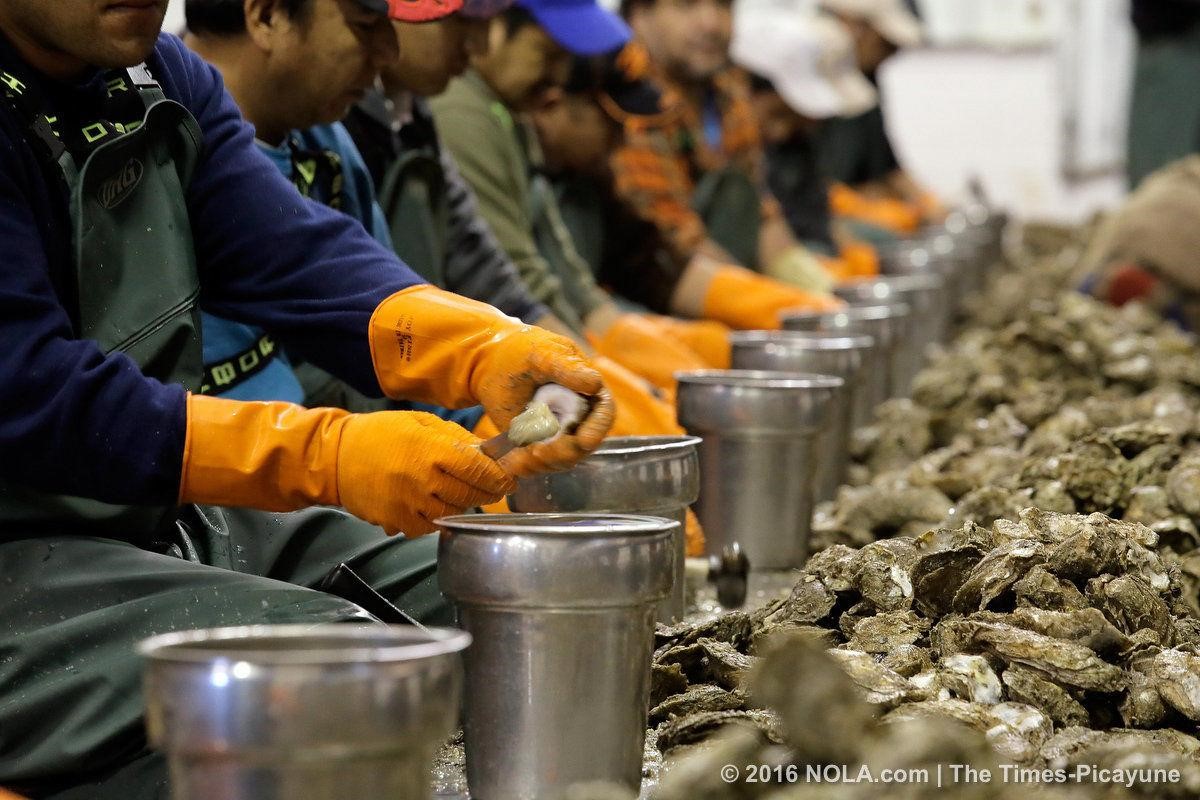
Seafood processing or seafood product preparation and packaging comprises of establishments primarily engaged in one or more of the following: (1) canning seafood (including soup); (2) smoking, salting, and drying seafood; (3) eviscerating fresh fish by removing heads, fins, scales, bones, and entrails; (4) shucking and packing fresh shellfish; (5) processing marine fats and oils; and (6) freezing seafood. Establishments known as "floating factory ships" engaged in the gathering and processing of seafood into canned seafood products are included in this industry (U.S. Bureau of Census, https://www.census.gov/eos/www/naics/index.html).
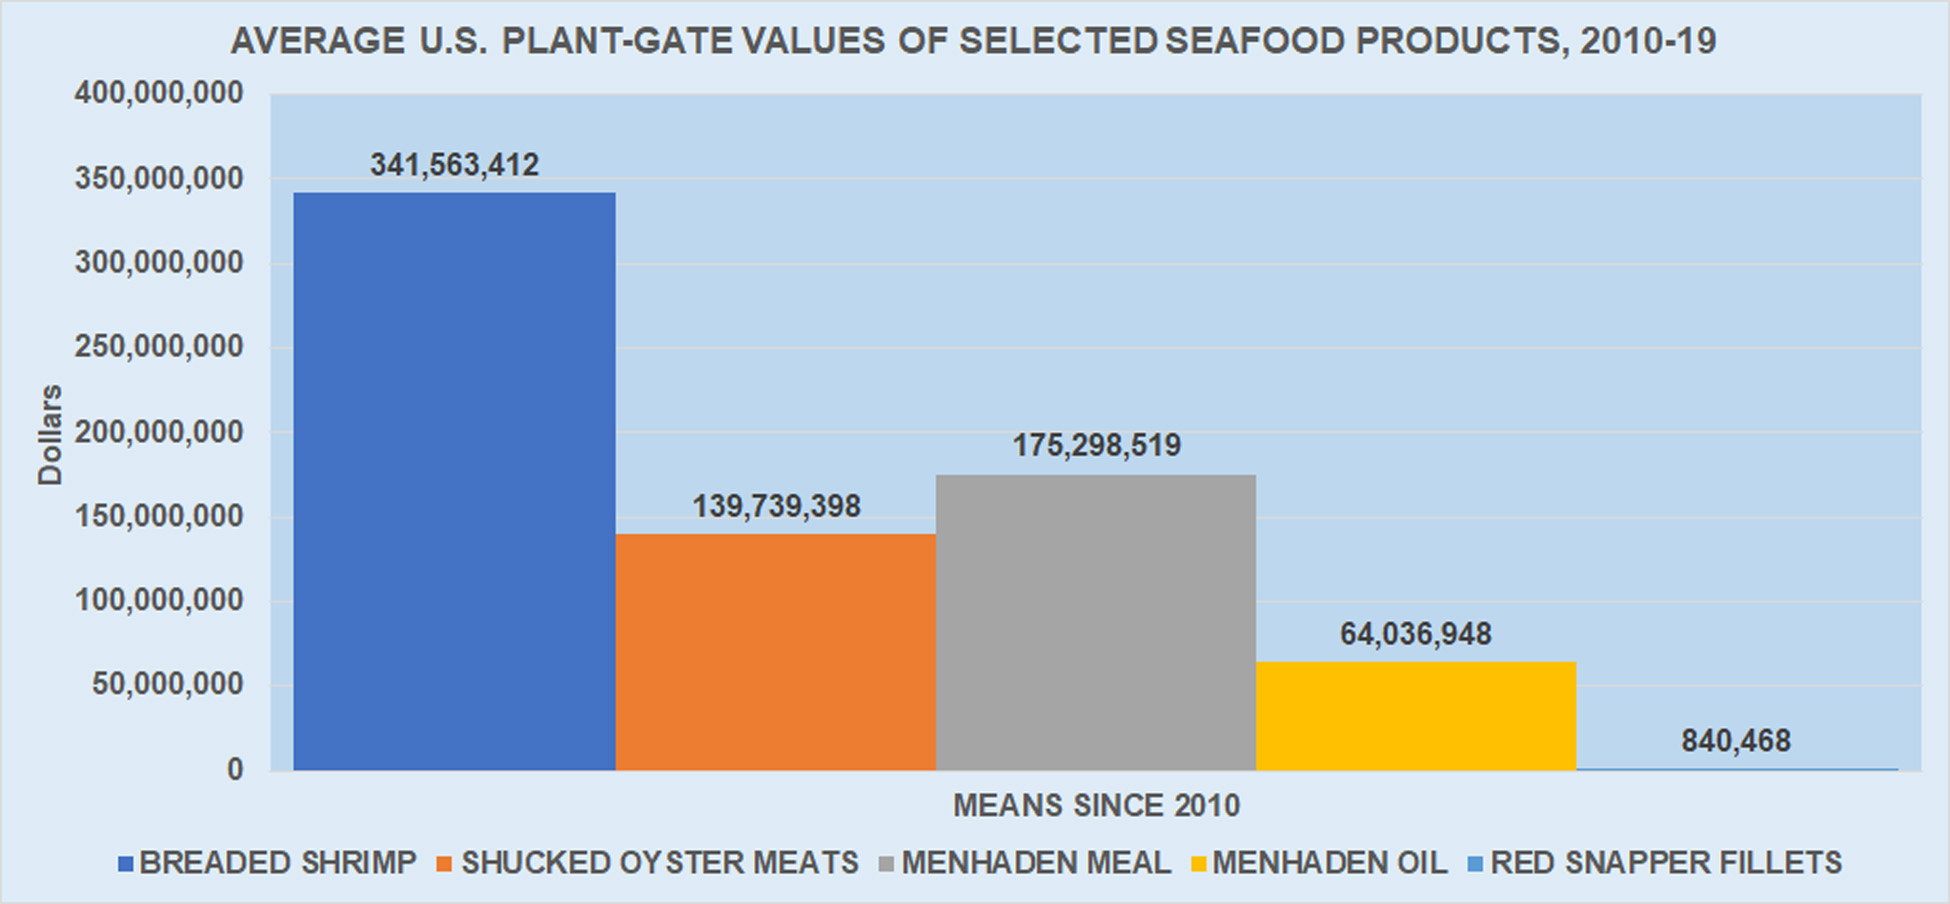
The most valued species commercially landed in the Gulf of Mexico States and processed by U.S. seafood processing plants are white and brown shrimp, menhaden, oysters, and red snapper. The annual plant-gate value of breaded shrimp averaged $341 million per year since 2010. Shucked oyster meats averaged $139 million during the past decade. Menhaden meal and oil added $176 and $64 million, respectively. About $0.84 million red snapper fillets were processed annually during the past decade.
Seafood Processing Employment and Wages, Salaries, and Earnings
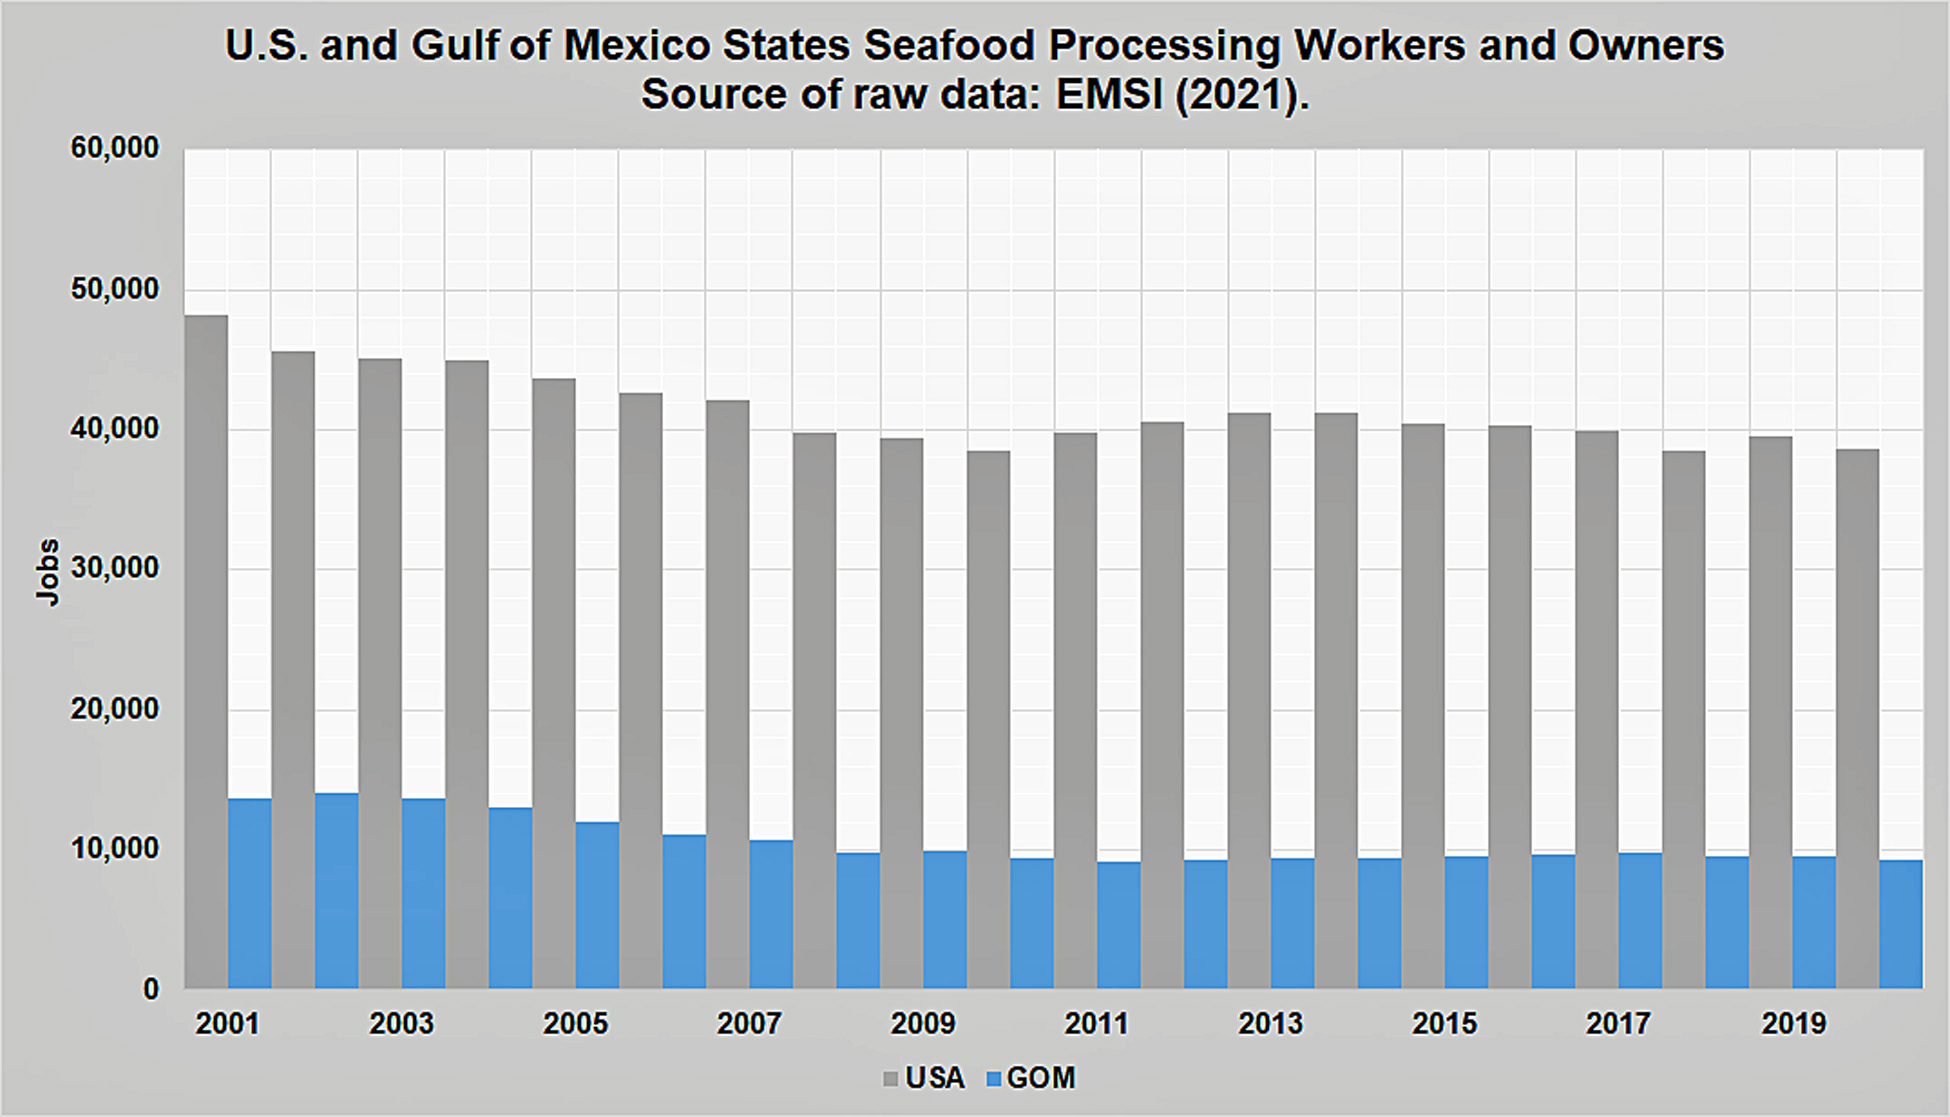
The seafood processing industry directly provided almost 40,000 jobs per year in the U.S. during the past decade (Figure 2). The five Gulf of Mexico states (AL, FL, LA, MS, and TX) contributed about 24 percent of all the seafood processing jobs during the period.
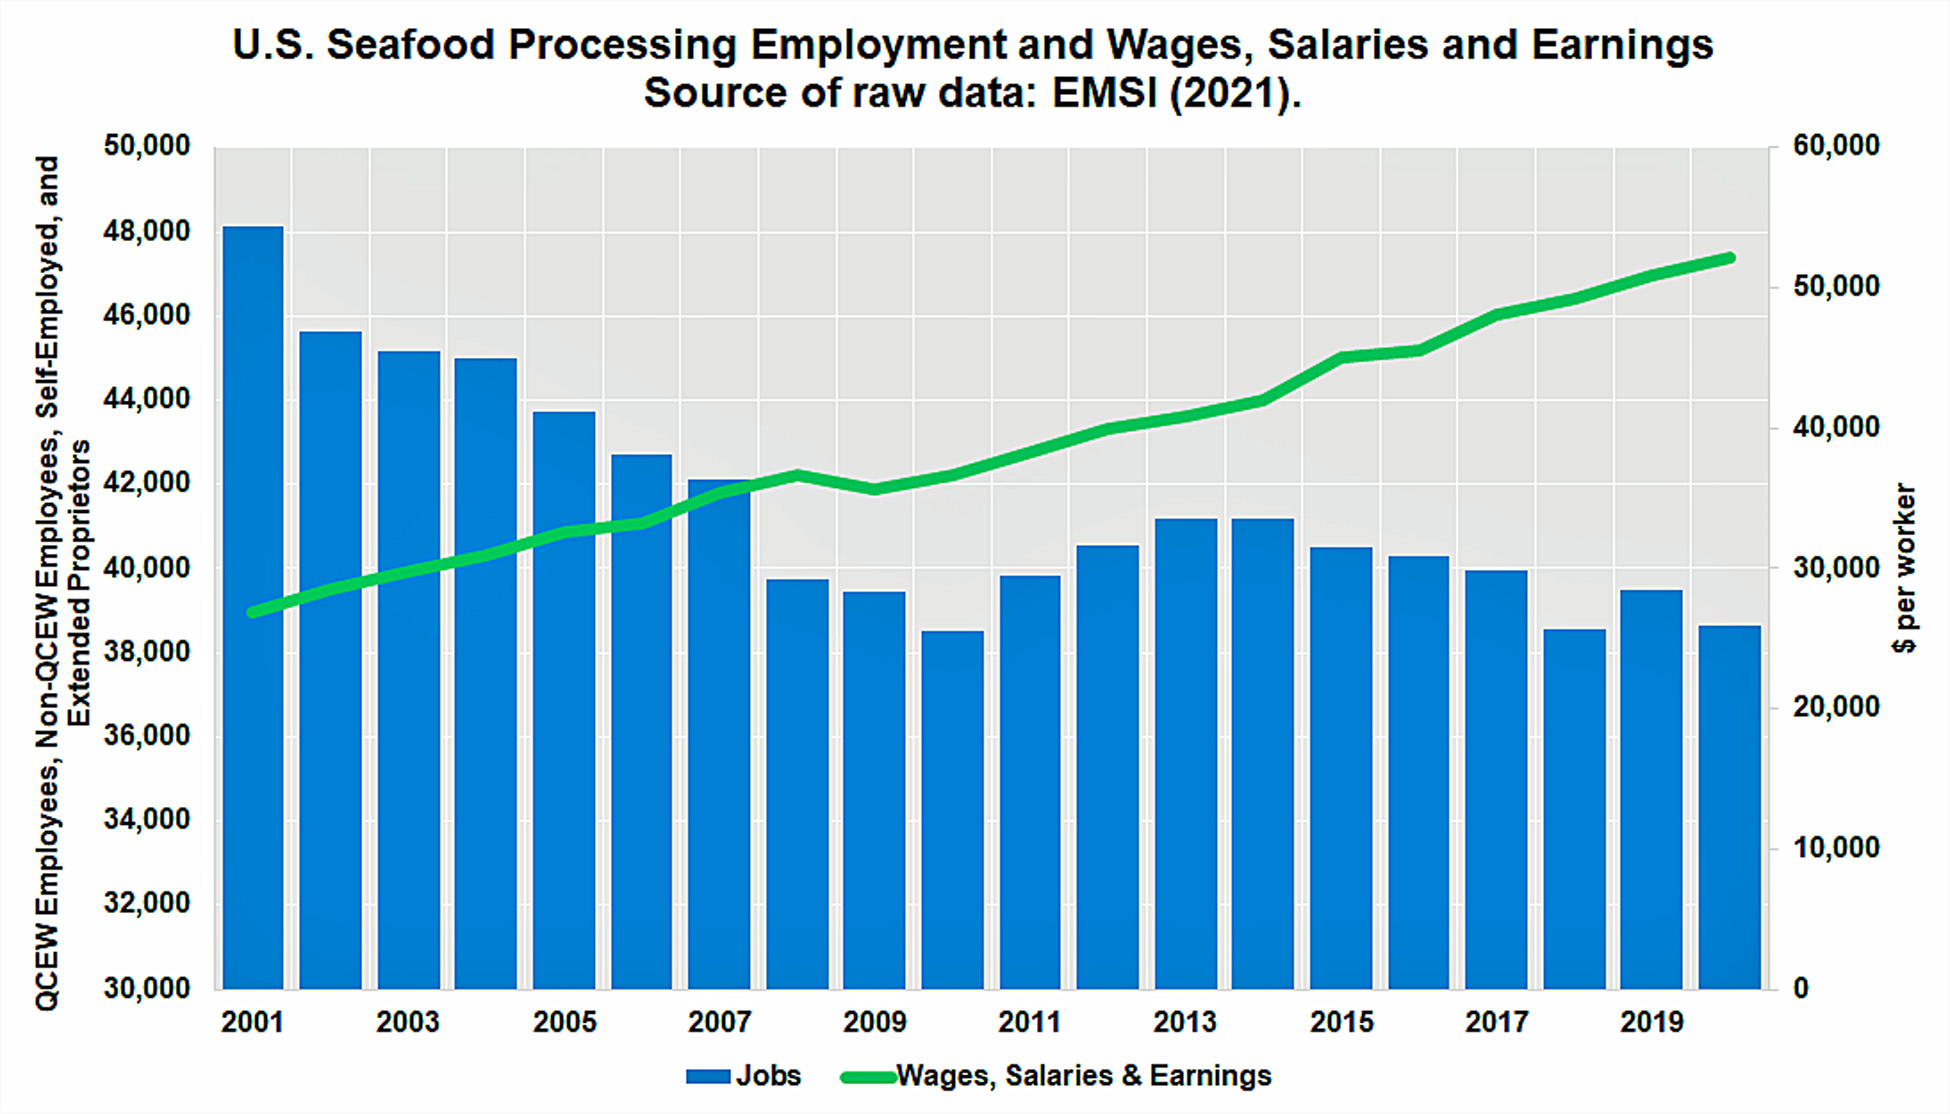
The combined wages, salaries, and proprietor earnings (at constant 2020 prices) of all the QCEW employees, non-QCEW employees, self-employed, and extended proprietors averaged more than $44,000 per person the past decade (Figure 3). The annual pay of workers and owners of seafood processing businesses in the five Gulf of Mexico States averaged more than $34,000 per person or 77 percent of the national average.
Distribution of Seafood Processing Employees and Owners by Gender
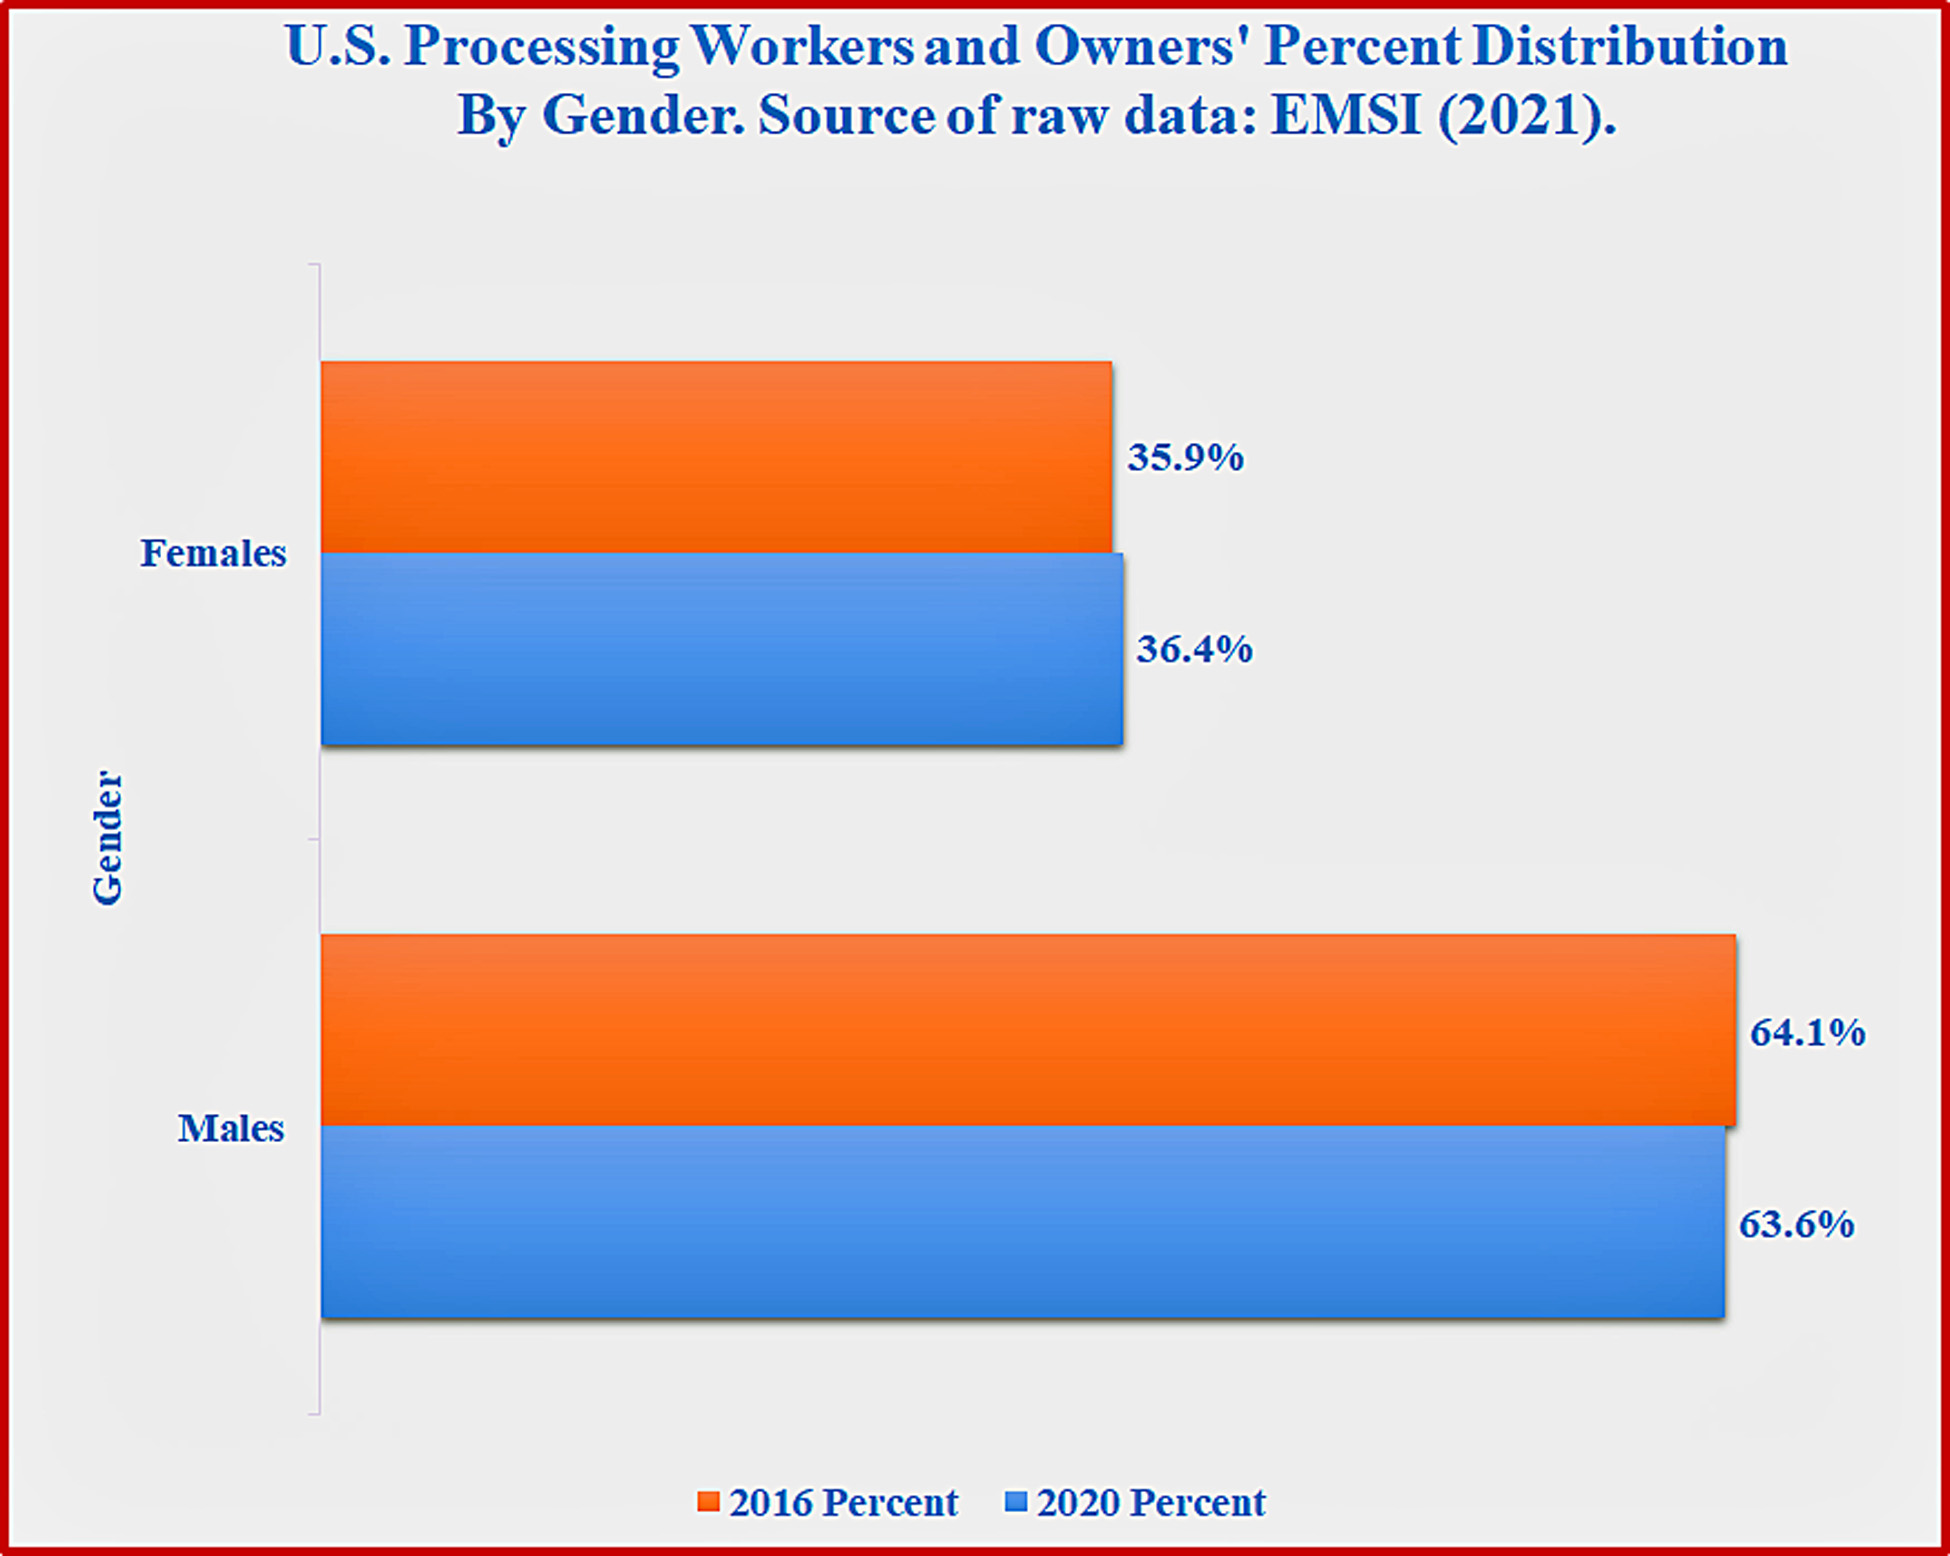
The 2020 industrial overview released by EMSI (April 2021) showed that approximately 63.6 percent were males (Table 1). About 36.4 percent of the seafood processing workers and boat owners were females. In the Gulf States, 53.7 percent are males, while 46.3 percent are females.

The proportion of male workers and owners declined from 64.1 to 63.6 percent from 2016 to 2020 in the entire U.S. seafood processing industry (Figure 4). This downward trend resulted in relatively more women workers and owners entering the seafood processing industry.
Distribution of Seafood Processing Employees and Owners by Race or Ethnicity
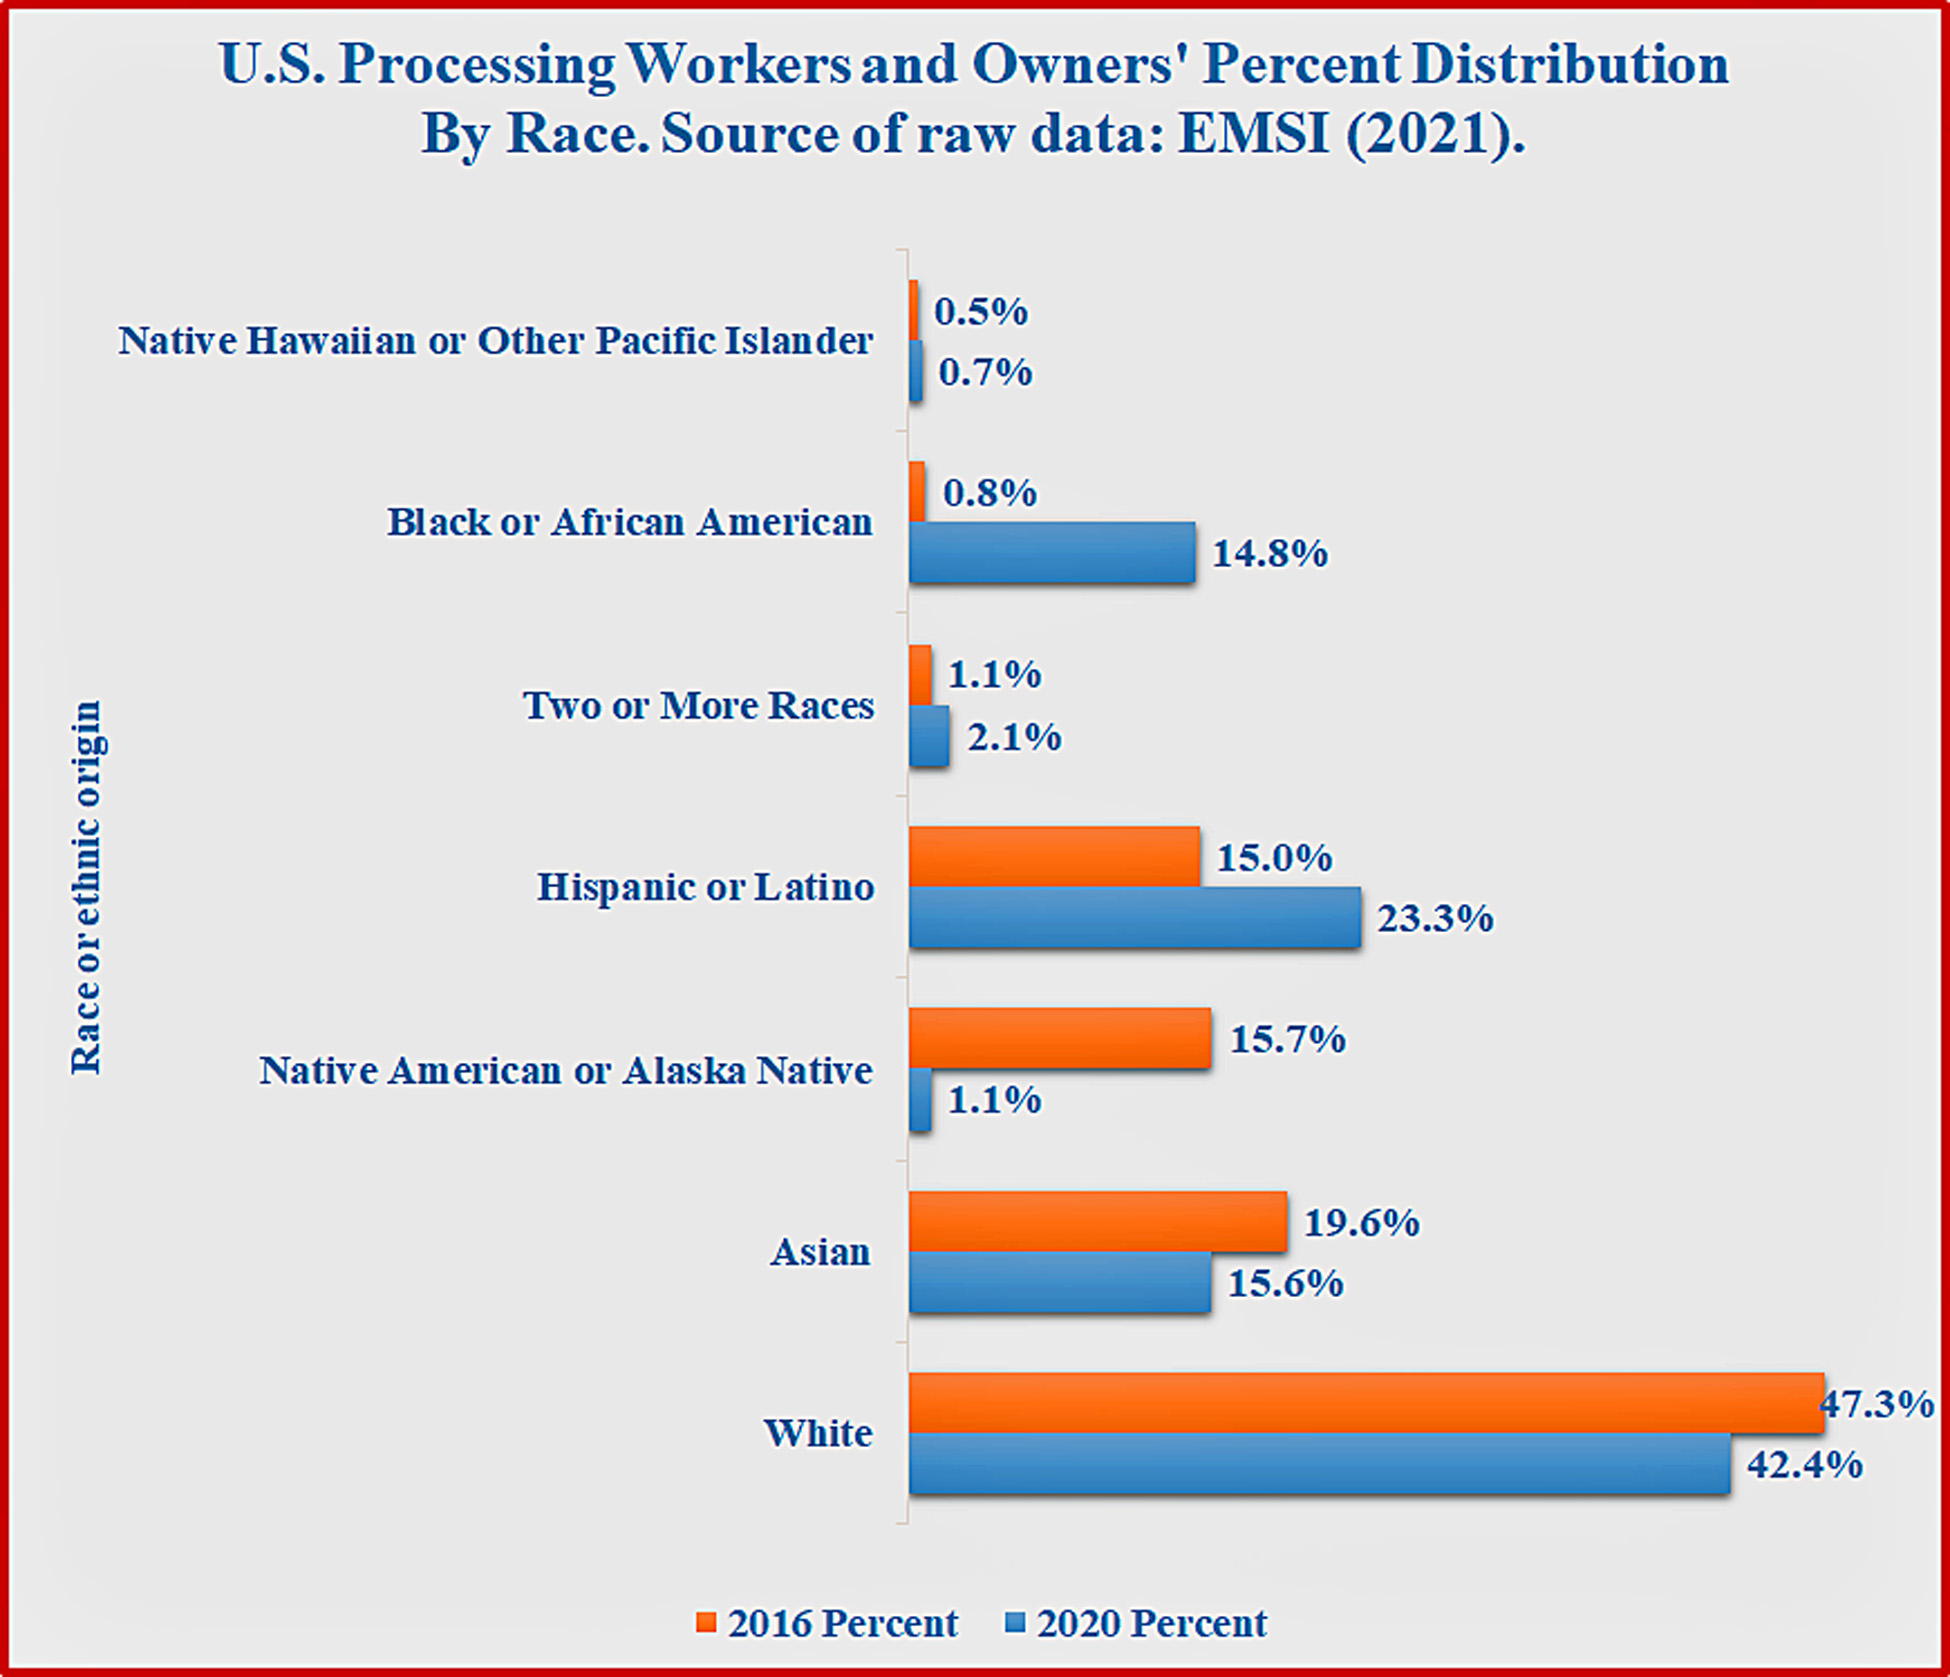
The 2020 industrial overview disseminated by EMSI (April 2021) also categorized the workers and owners by race or ethnicity (Table 2). Most of the workers are Whites (42.4%), followed by Hispanic or Latino (23.3%), Asians (15.6%), and African Americans (14.8%). The rest are with two or more races (0.7%), Native Americans or Alaska Native (1.1%), and Native Hawaiians or Pacific Islanders (0.3%).
In the Gulf States, relatively more African Americans and Hispanics are engaged in seafood processing. Fewer Whites and Asians are gainfully employed in seafood processing.

Some changes in the 2020 race distribution of workers and owners contrasted to the 2016 race distribution (Figure 5). Relatively lower percentages of workers and owners were observed among Whites, Asian employees, and Native Americans. Higher proportions were detected among Hispanics, African Americans, and Native Hawaiian workers and owners in 2020.
Distribution of Seafood Processing Employees and Owners by Age
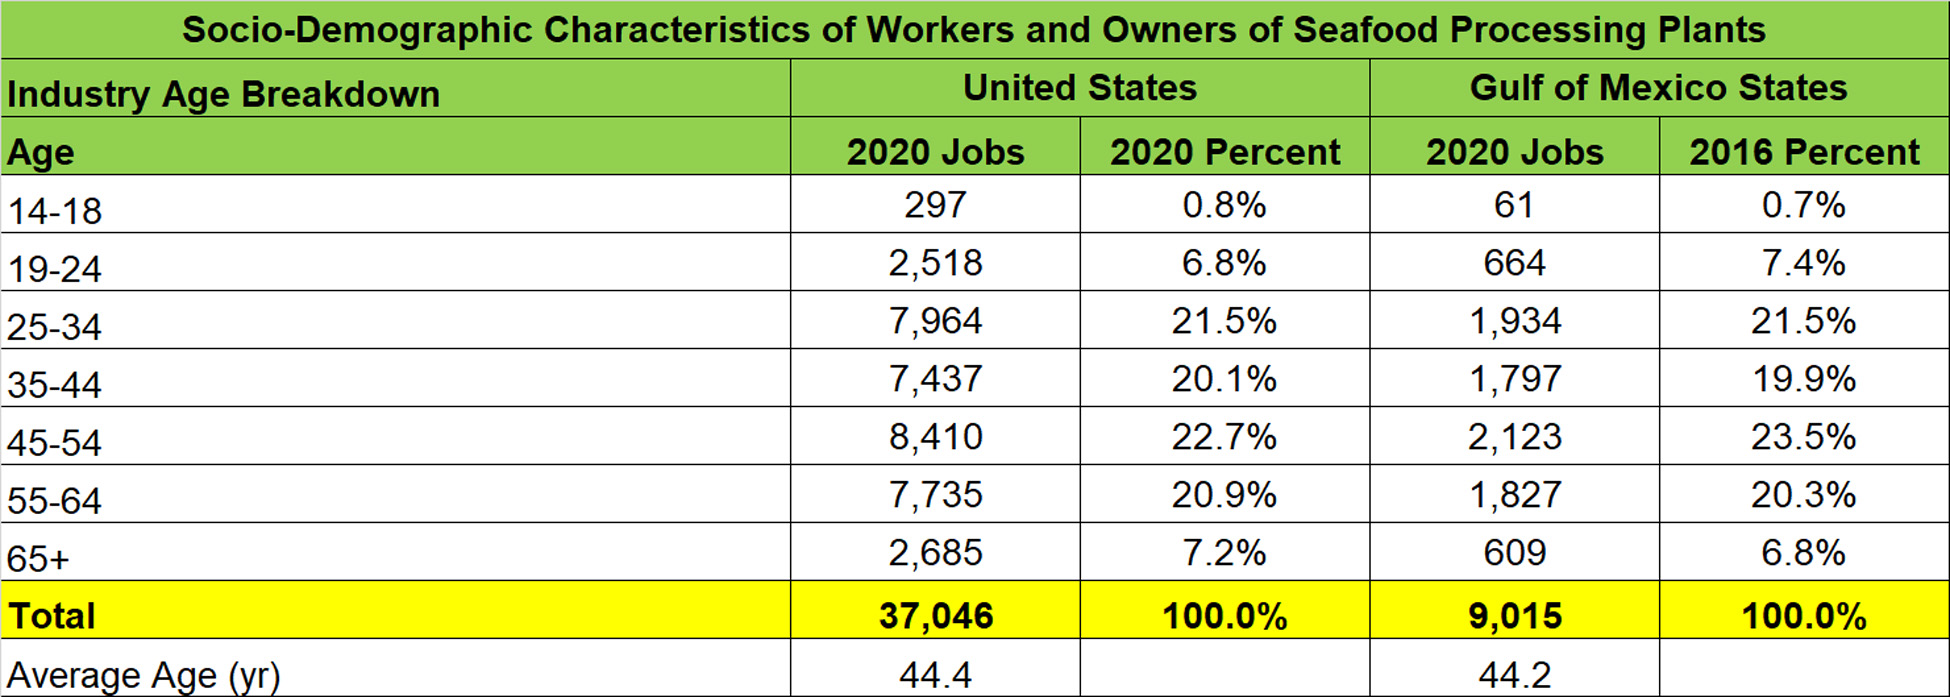
The 2020 industrial overview published by EMSI (April 2021) also classified the workers and owners by age (Table 3). About 7.2 percent of the workers and owners are 65 years old and above. One out of five workers and owners were 55-64 years old. The 45-54 years old group added 22.7 percent of the total. The 35-44 years old consisted of 20.1 percent of all workers and owners. The younger employees and owners comprised the rest of the workforce.
The seafood processing workers and owners in the Gulf States are relatively younger than the national average. Gulf workers and owners averaged 44.2 years old compared to 44.4 years old among all U.S. workers and owners.
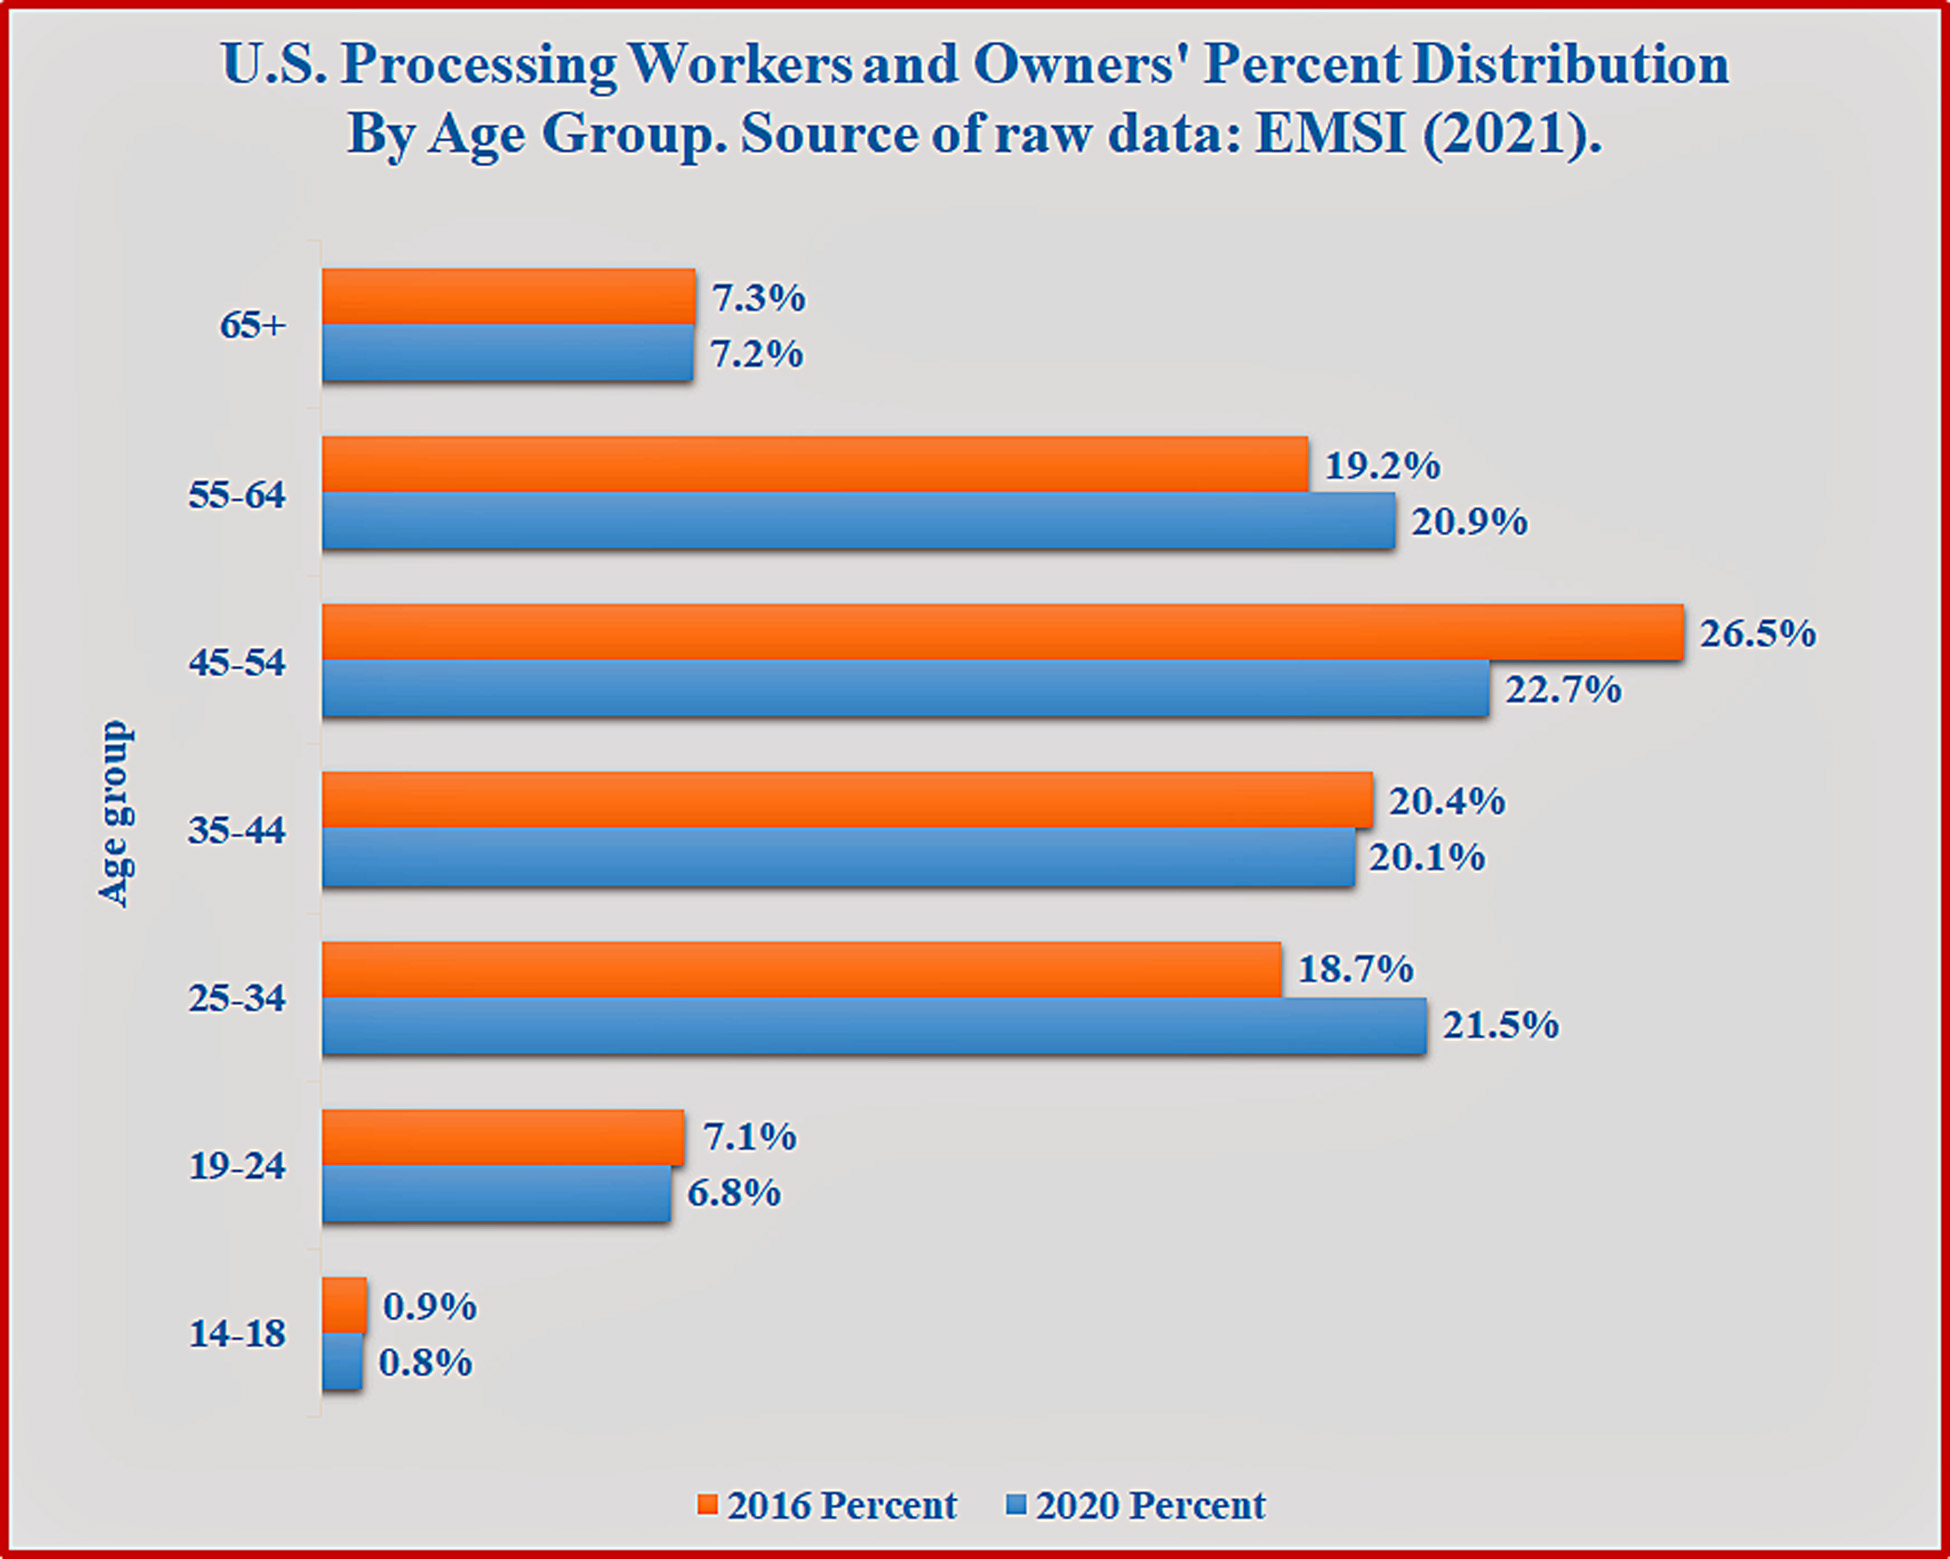
Compared to the 2016 age profiles, seafood processing workers and owners were about 0.3 years younger in 2020. Lower percentages of 65 years old and above and 45-54 years old workers and owners were reported in 2020 compared to 2016 (Figure 6). However, there was a surge among 55-64 and 25-34 year old workers and owners. Lower proportions were observed among 35-44 years old and below 19 years old groups in 2020 compared to 2016.
My Gulf Seafood Processing Economics Outreach
Posadas, Benedict C. Number, Wages, Salaries and Earnings, and Socioeconomic Characteristics of Seafood Processing Workers and Owners. Mississippi MarketMaker Newsletter, Vol. 11, No. 5. May 11, 2021. http://extension.msstate.edu/newsletters/mississippi-marketmaker.
Posadas, Benedict C. Seafood Processing jobs, incomes, and profiles. Horticulture, Marine and Disaster Economics Outreach. Virtual presentation. Mississippi State University, Coastal Research and Extension Center, Biloxi, Mississippi. https://youtu.be/nxd3HIjD0Cg.
Posadas, Benedict C. Economic Contribution of Seafood Processing in Mississippi and Alabama Gulf Coasts. Mississippi MarketMaker Newsletter, Vol. 10, No. 1. January 21, 2020. http://extension.msstate.edu/newsletters/mississippi-marketmaker.
Posadas, Benedict C. Seafood Processing Employment and Incomes in the Gulf of Mexico and the United States. Mississippi MarketMaker Newsletter, Vol. 7, No. 20, October 24, 2017. http://extension.msstate.edu/newsletters/mississippi-marketmaker.
Posadas, Benedict C. 2018. Economic Contributions of the Mississippi Seafood Industry by Major Species in 2015. MSU Extension Publication 3194 and Mississippi-Alabama Sea Grant Publication MASGP-17-070. Mississippi State, Mississippi.
Posadas, Benedict C. 2014. Economic Impacts of the Mississippi Seafood Industry in the Year 2009 by Major Species. Mississippi Agricultural and Forestry Experiment Station Bulletin 1209, Mississippi State, Mississippi.
Suggested Citation
Posadas, B.C. Number, Wages, Salaries and Earnings, and Socioeconomic Characteristics of Seafood Processing Workers and Owners. Mississippi MarketMaker Newsletter, Vol. 11, No. 5. May 11, 2021. http://extension.msstate.edu/newsletters/mississippi-marketmaker.

