This virtual presentation is a contribution of the Mississippi Agricultural and Forestry Experiment Station and the Mississippi State University Extension Service.
This material is based upon work that is supported in part by the National Institute of Food and Agriculture, U.S. Department of Agriculture, Hatch project under accession number 081730 and
Mississippi-Alabama Sea Grant Consortium using federal funds under Grant NA22OAR4170090 from the National Sea Grant Office, NOAA, U.S. Dept. of Commerce.
The statements, findings, conclusions, and recommendations are those of the author and do not necessarily reflect the views of the National Sea Grant Program, NOAA, U.S. Department of Commerce.
Let Us Start Our Modeling Effort!
The NOAA Fisheries data on freshwater crawfish aquaculture production and commercial landings are reported in pounds and dollars per year, respectively.
Dockside prices are imputed from dockside values and commercial landings.
Farmgate prices are imputed from farmgate values and annual production.
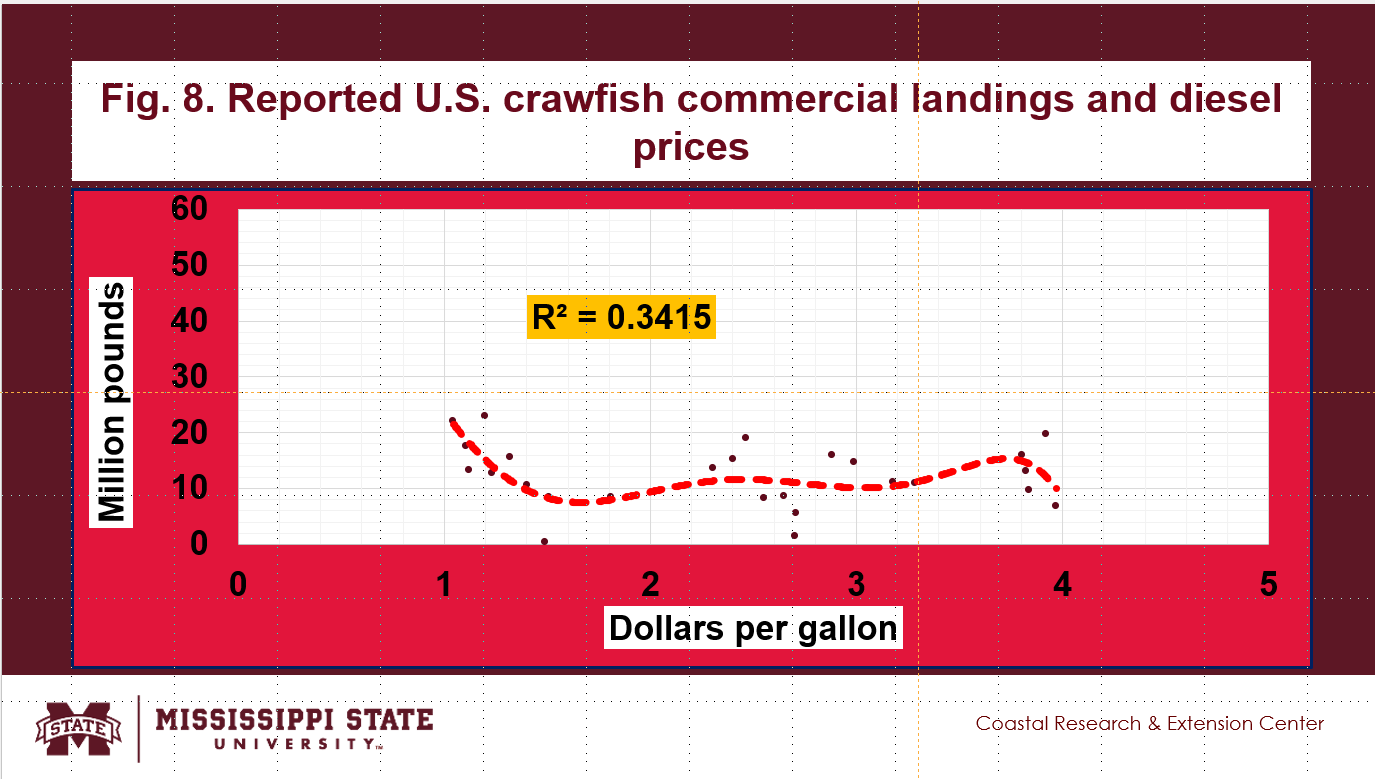
Scatter diagrams show the relationships between freshwater crawfish aquaculture production and commercial landings versus diesel prices.
Econometric models are estimated to determine significant determinants of aquaculture production.
U.S. Aquaculture Economic Model
The Ordinary Least Squares (OLS) model of U.S. aquaculture consisted of the following dependent variable:
Aquaculture production (lb/yr),
The OLS models of U.S. aquaculture were estimated using the robust variance procedure of STATA-17.
The variation inflation factor was calculated to detect the possible presence of multicollinearity.
The marginal impacts of disaster events were computed using the margins procedure.
The OLS model of U.S aquaculture production (lb/yr) assumed that annual production could be explained by the following variables:
year,
real farmgate and dockside prices ($/lb),
recession, trade war, pandemic, and Gulf natural disasters (1 or 0),
unemployment rate, real diesel prices and per capita disposable income (%),
other variables
U.S. Crawfish Aquaculture Producers
The U.S. Aquaculture Censuses reported that crawfish farms numbered 436 farms in 2013 and 482 farms in 2018.
Total crawfish aquaculture sales reached $35 M in 2013 and $50 M in 2018.
In number of farms, the top farming states in 2018 are Louisiana (449 farms), Texas (12 farms), and South Carolina (5 farms).
Annual crawfish aquiculture sales reported during the aquaculture censuses were 24 percent of the reported annual crawfish aquaculture sales by NOAA Fisheries in 2018 and 2013.
Almost three-fourths of the annual crawfish aquaculture sales are not included in the 2013 and 2018 annual censuses.
U.S. Crawfish Aquaculture Production and Farmgate Values
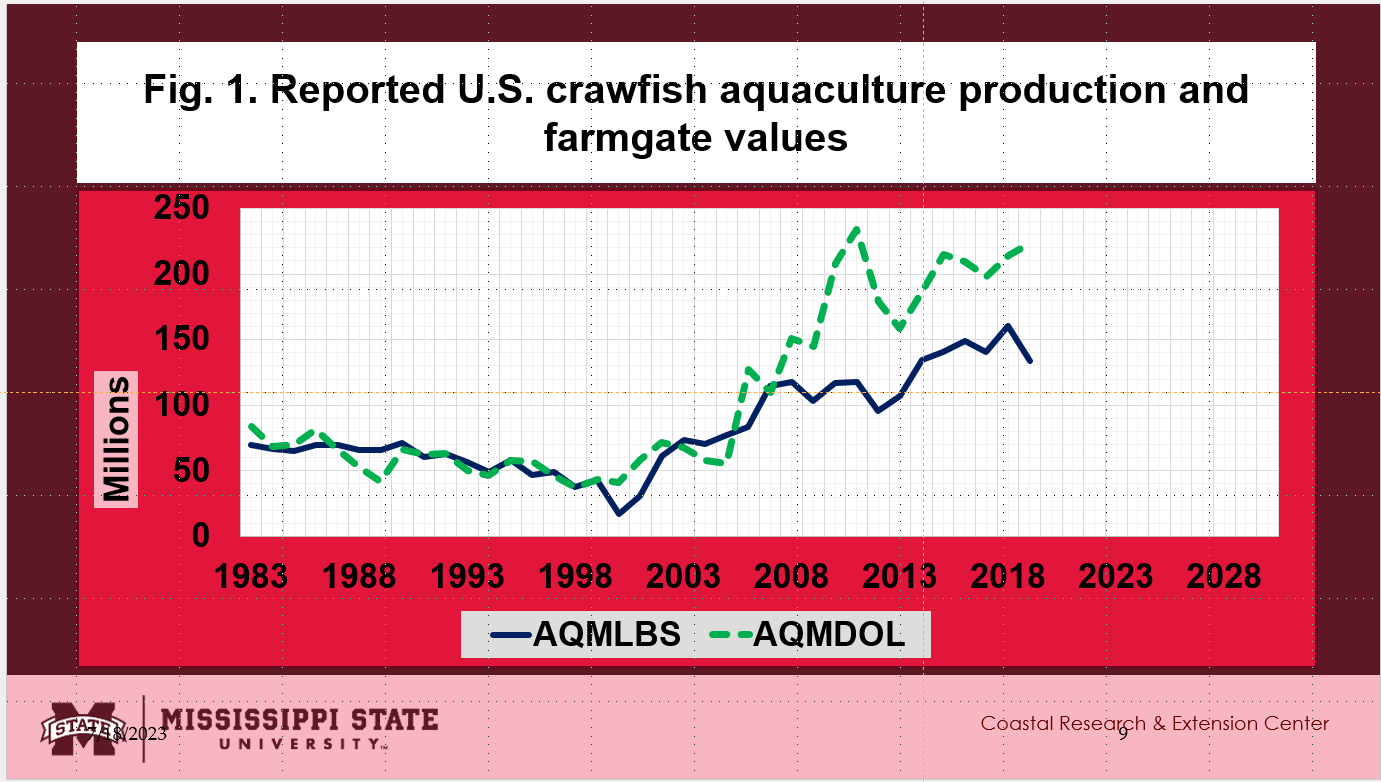
The annual crawfish aquaculture production since 1983 are shown in Fig. 1.
The blue curve shows the annual aquaculture production reported from 1983 to 2019.
The green curve shows the annual aquaculture farmgate values reported from 1983 to 2019.
Annual production seems to have recovered since its decline in 2000.
U.S. Crawfish Aquaculture Production and Commercial Landings
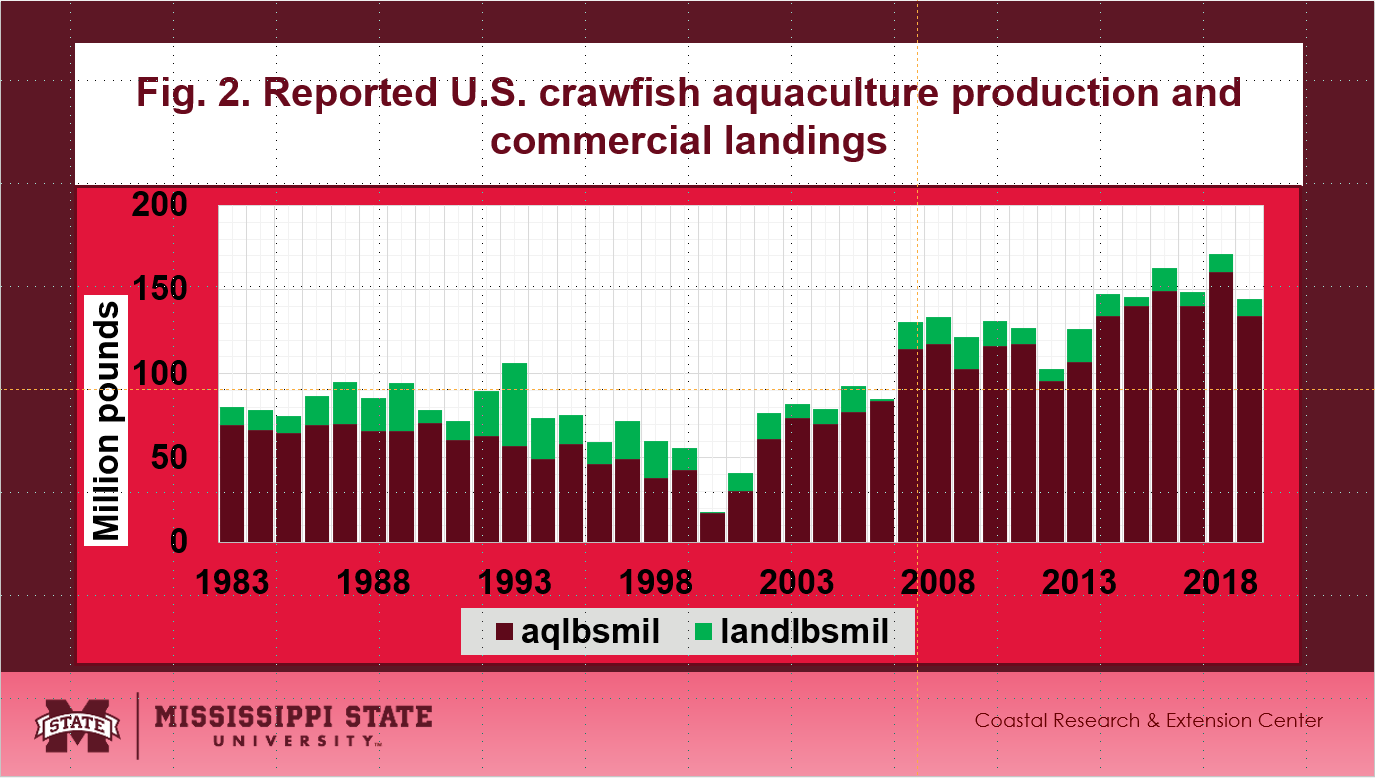
Annual crawfish aquaculture production and commercial landings since 1983 are shown in Fig. 2.
The maroon bars show annual aquaculture production reported from 1983 to 2019.
The green bars show annual commercial landings reported from 1983 to 2019.
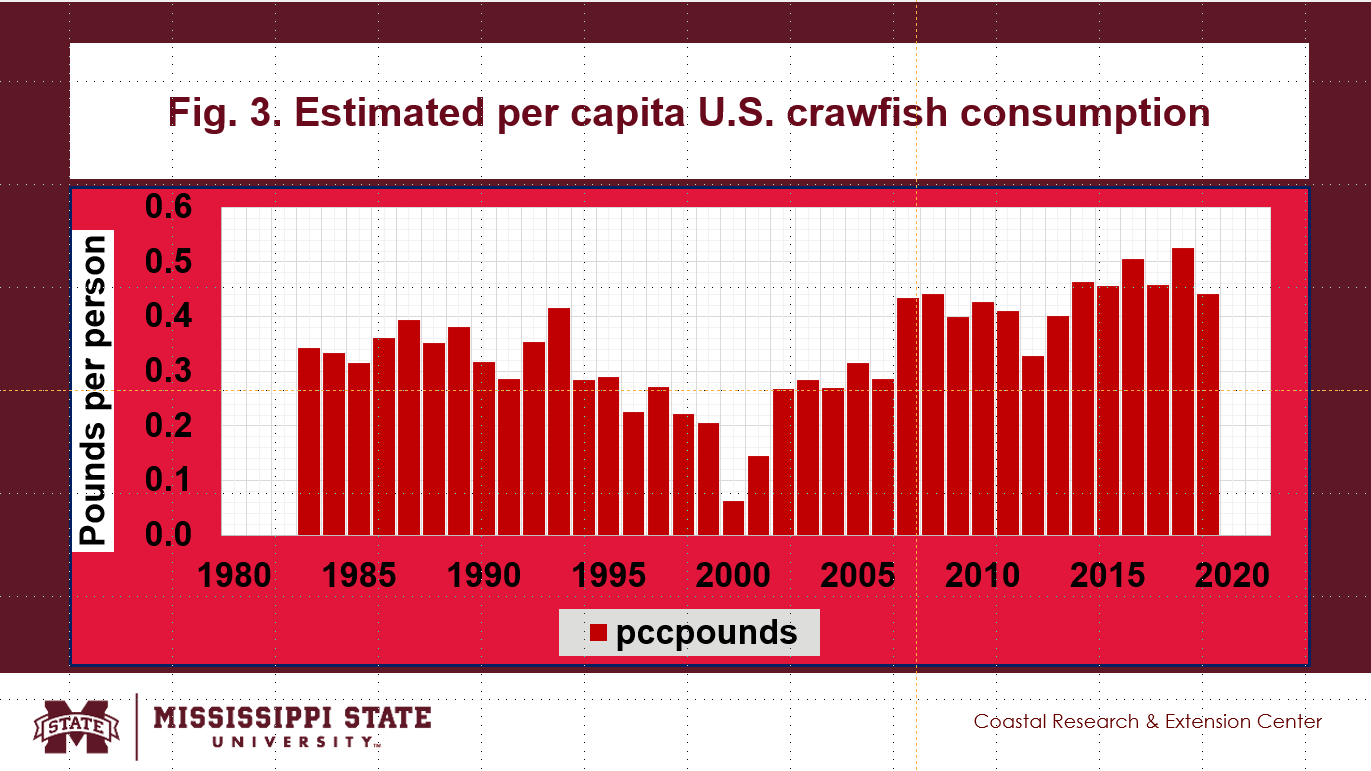
Annual per capita U.S. crawfish consumption since 1983 are shown in Fig. 3.
Reported U.S. Crawfish Aquaculture Farmgate and Landing Values
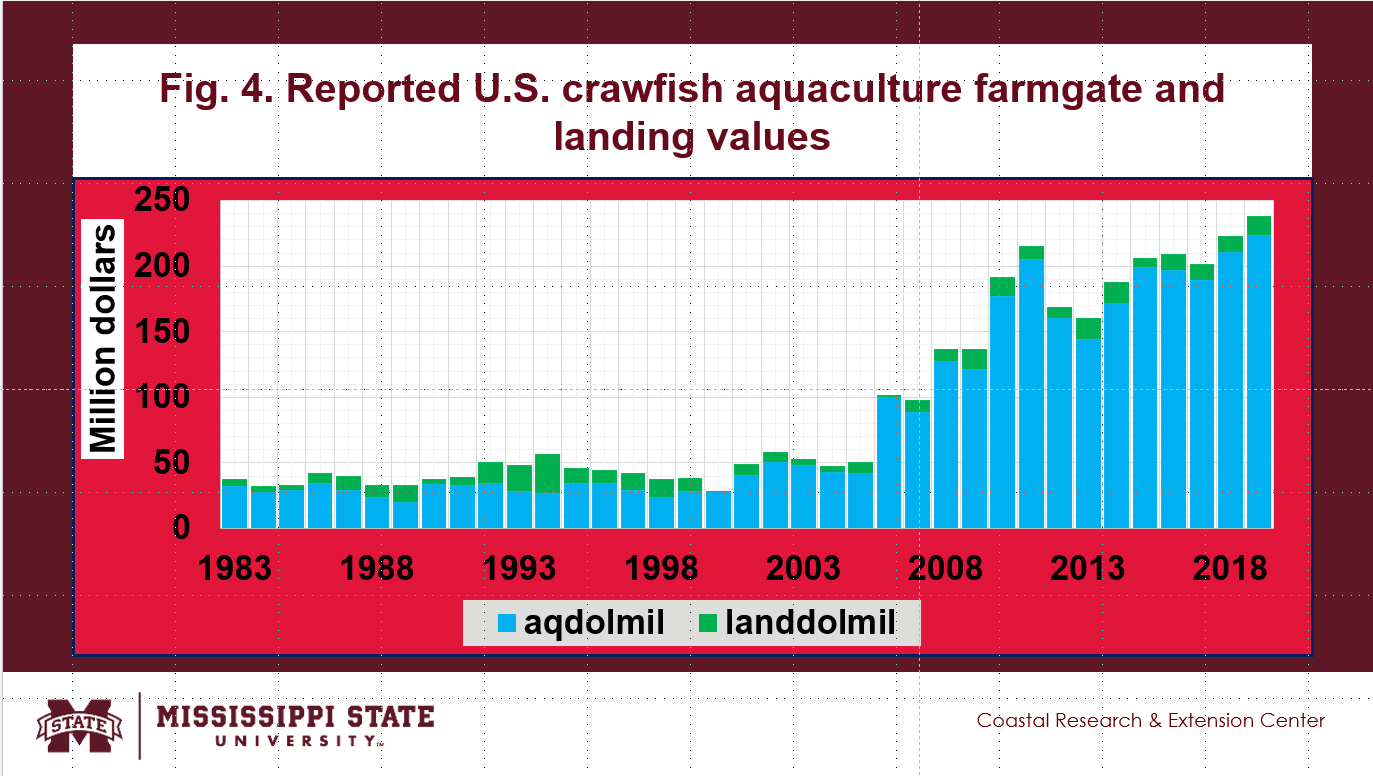
The reported U.S. crawfish aquaculture farmgate and landing values are shown in Fig. 4.
The blue bars show annual aquaculture farmgate values reported from 1983 to 2019.
The green bars show annual commercial landing values reported from 1983 to 2019.
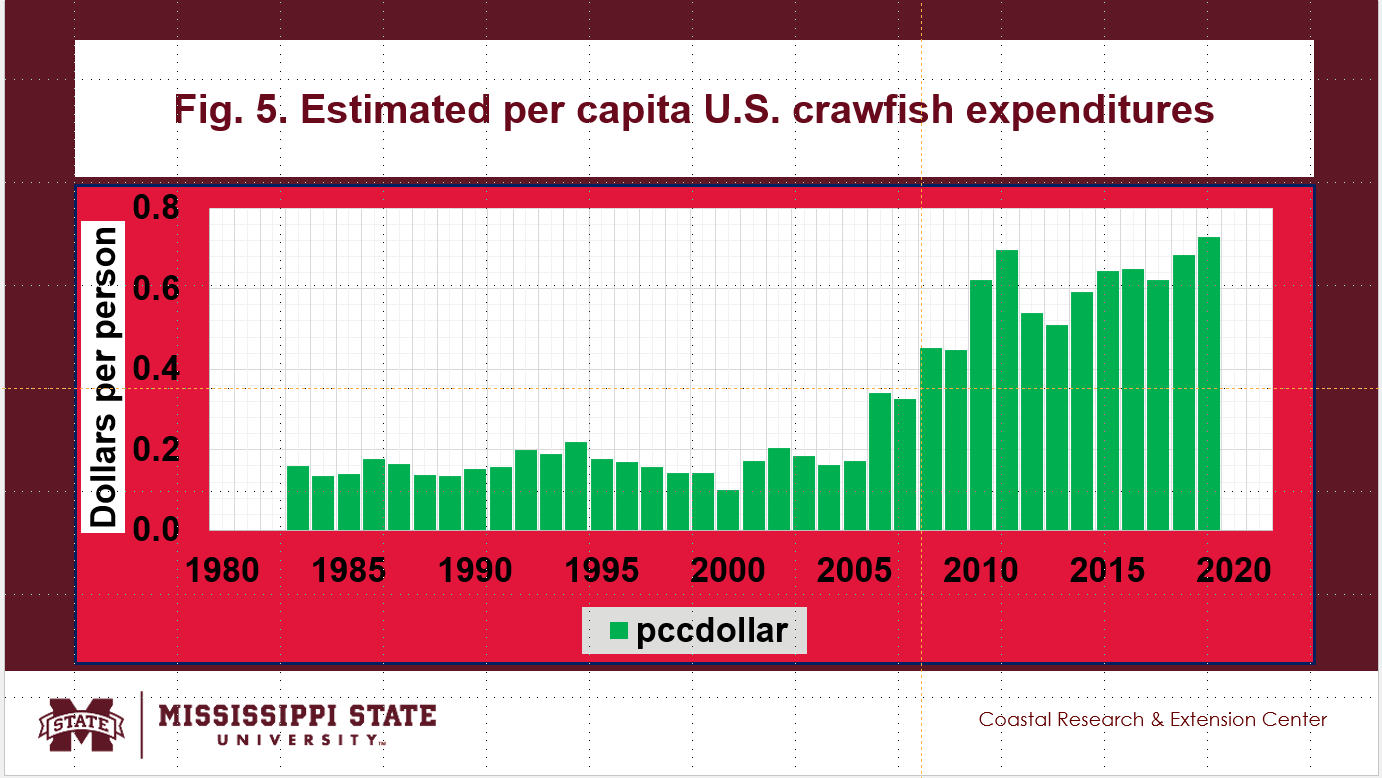
Annual per capita U.S. crawfish expenditures are shown in Fig. 5.
Reported and Predicted U.S. Crawfish Aquaculture Production
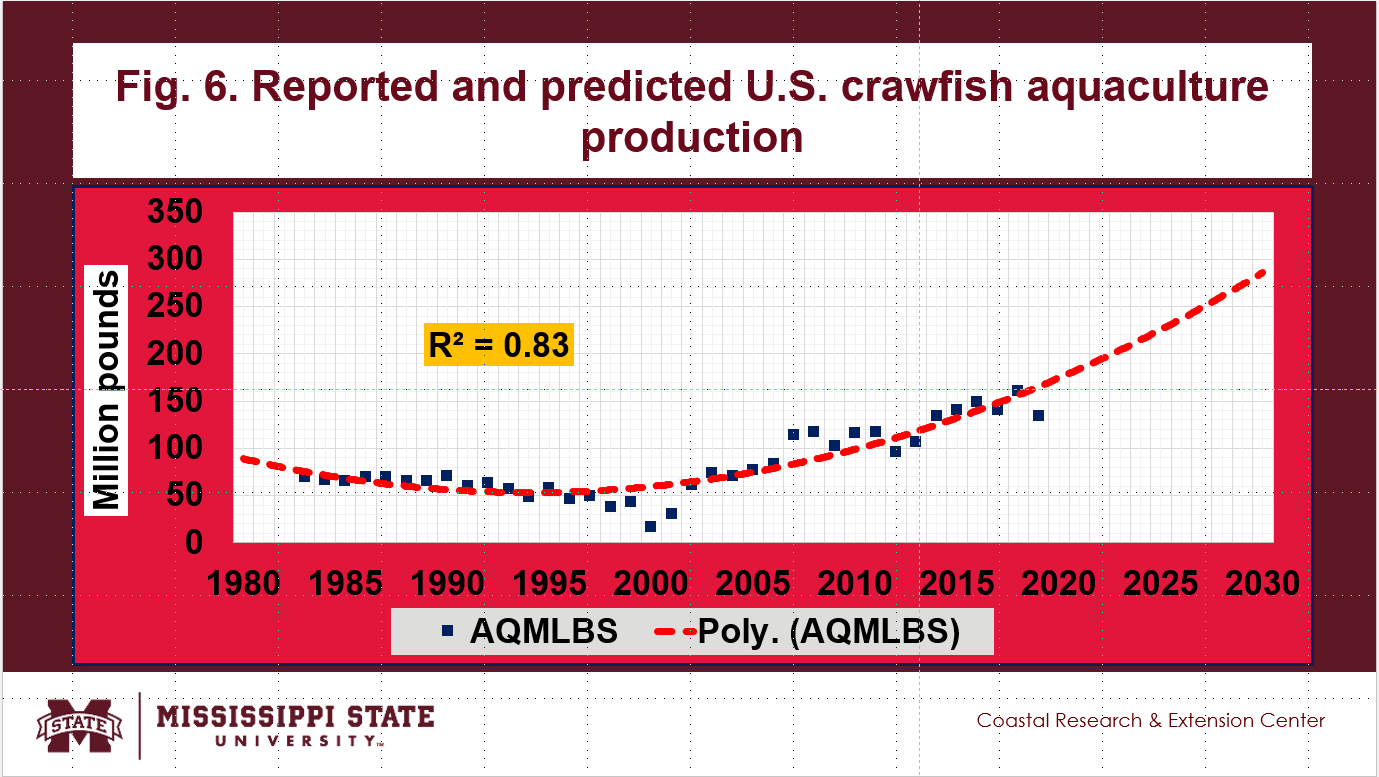
The reported and predicted U.S. crawfish aquaculture production up to 2030 are shown in Fig. 6.
The blue dots show the reported crawfish aquaculture production from 1983 to 2019.
The red dotted curve is an Excel-generated polynomial curve predicting annual crawfish aquaculture production up to 2030.
U.S. Crawfish Aquaculture Production and Commercial Landings vs. Diesel Prices
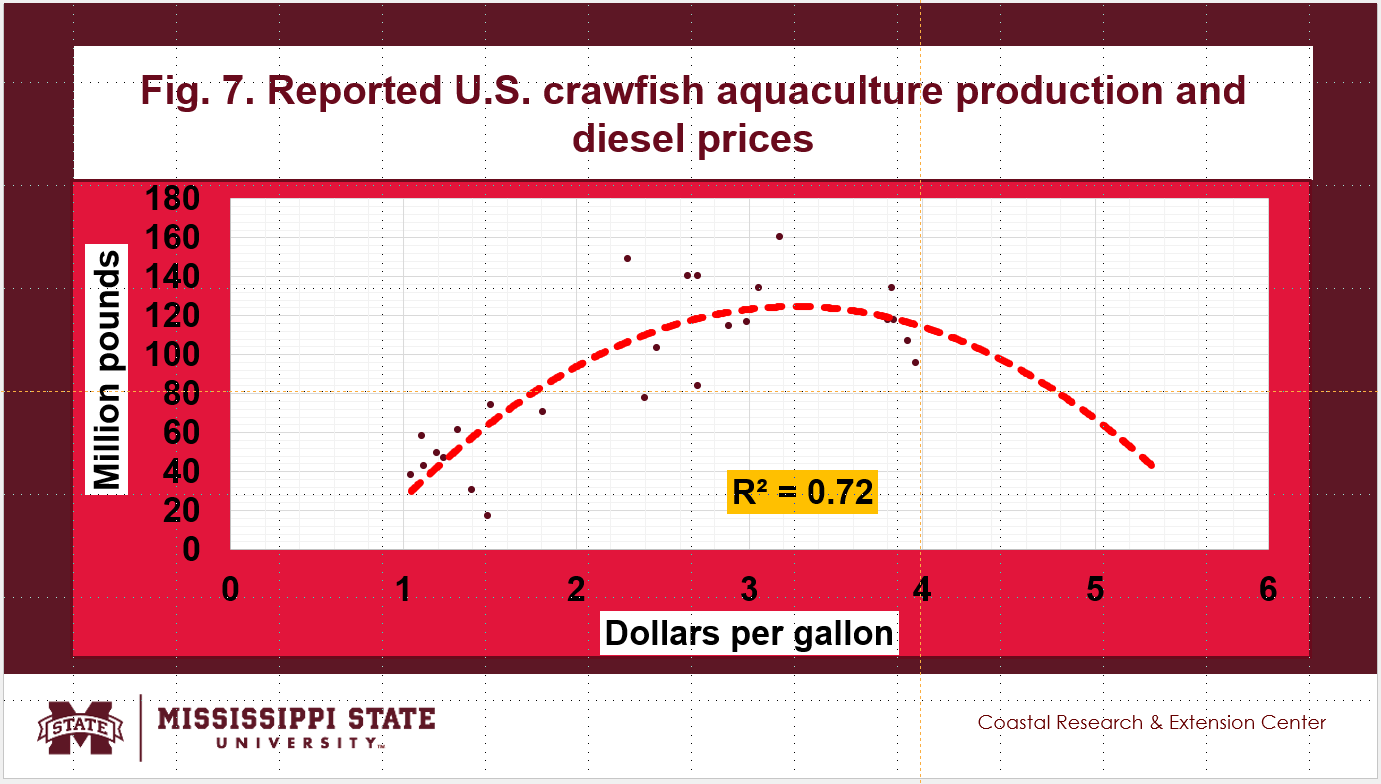
The impacts of diesel prices on the reported crawfish aquaculture production are shown in Fig. 7. It seems that negative impacts are observed when diesel prices approached $4.00 per gallon.
The impacts of diesel prices on the reported commercial crawfish landings, shown in Fig. 8, are not very clear.
Summary, Limitations, and Implications
There were large discrepancies in the annual sales reported during aquaculture censuses as compared to the annual crawfish sales reported by NOAA Fisheries in 2018 and 2013.
Almost three-fourths of the annual crawfish sales are not included in the 2013 and 2018 annual censuses.
Annual crawfish aquaculture production recovered since its decline in 2000.
Annual crawfish aquaculture farmgate values have been rising since 2006.
Annual per capita U.S. crawfish consumption continued rising since 2000.
Annual per capita U.S. crawfish expenditures were expanding since 2006.
Diesel prices negatively impacted crawfish aquaculture production when prices rose approached $4.00 per gallon.
For accessibility assistance please contact Ben Posadas at ben.posadas@msstate.edu