
Vol. 15, No. 7 / Direct Revenues From Tariffs and Their Impacts on Prices of U.S. Crawfish Imports
July 7, 2025
ABSTRACT
- This newsletter describes the revenue impacts of tariffs, identifies the types and sources of U.S. crawfish imports, and measures the impacts of tariffs on import prices.
- It shows the long-term annual and the major sources of the U.S. crawfish imports. The bulk of crawfish imports come from China, averaging 67% since 2019.
- It also summarizes the calculated duties on crawfish imports per year. The U.S. crawfish imports from China are subjected to calculated duties, averaging 25% of total annual values.
- An econometric model is estimated to determine the impacts of calculated duties on the prices of imported crawfish products. Deflated import prices of the U.S. crawfish imports fell over time, reduced at higher calculated duties, lower for frozen crawfish as compared to peeled crawfish, and lesser for crawfish imports from China.
- Results indicate that the tariff burdens on the U.S. imports of crawfish were absorbed mostly by the exporting countries and not much by U.S. importers.
KEYWORDS
- Crawfish imports, calculated duties, and major crawfish exporters
REVENUE IMPACTS
- Crawfish freshwater frozen and crawfish freshwater peeled
- Crawfish imports from China, primarily red swamp crawfish (Procambarus clarkii), play a significant role in both the global and U.S. crawfish markets.
- China is the world's largest producer of both wild-caught and farm-raised crawfish.
- China's crayfish farming area reached 1.73 million hectares in 2021, with a production of 2.63 million tons.
- Crayfish is an important export commodity for China, with the U.S. being a major market.
- The primary product exported from China is cooked and peeled crawfish tail meat.
- In summary, China's crawfish imports are a significant factor in the US market, impacting prices and domestic production while raising concerns about environmental sustainability and regulatory compliance.
- Source: Search Labs | AI Overview.
METHODS
- The direct revenue impacts of U.S. crawfish imports are the sum of the calculated duties imposed on imported crawfish products.
- Annual data on U.S. crawfish imports are compiled from the NOAA Fisheries website from January 1989 to April 2025.
- The calculated duties on crawfish imports are summarized per year per exporting country.
- An econometric model is estimated to measure the impacts of calculated duties on prices of imported crawfish products.
- Source of raw data: NOAA Fisheries.
U.S. CRAWFISH IMPORT PRICE MODEL
- The econometric model of U.S. CRAWFISH IMPORT PRICE (dollars per pound) assumes that import prices could be explained by:
- Year,
- Calculated duty (%),
- Type of crawfish product (1 or 0).
- Country of origin (1 or 0).
- Other variables
- The Ordinary Least Squares (OLS) model of U.S. CRAWFISH IMPORT PRICE consists of the following dependent variable:
- Deflated imputed average import price (dollars per pound).
- The OLS model of U.S. crawfish import price is estimated by using the robust variance procedure of STATA-18.
- The variation inflation factor is calculated to detect the possible presence of multicollinearity.
- The marginal impacts are computed using the margins procedure.
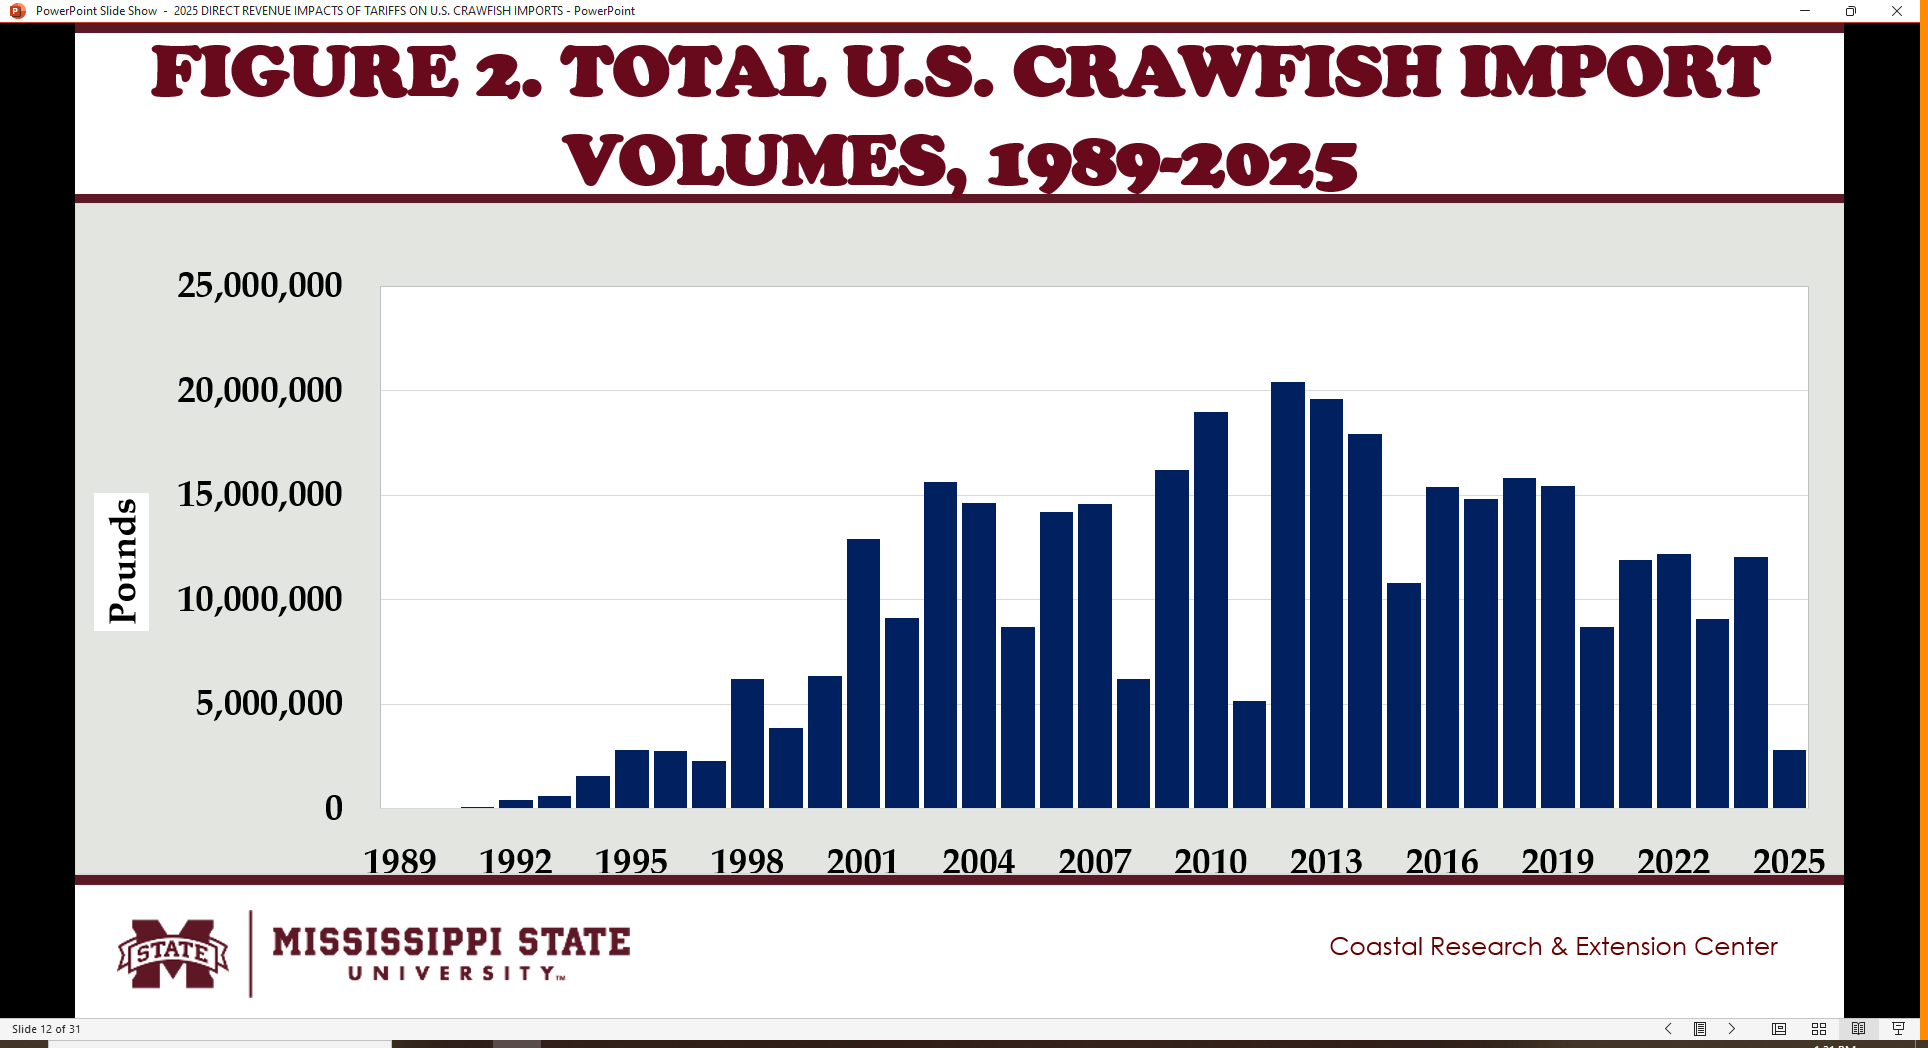
TOTAL U.S. CRAWFISH IMPORT VOLUMES, 1989-2025
- Fig. 2 shows the total U.S. crawfish import volumes since 1989.
- Import volume from 1989 to 1999 averaged 2.1 million pounds per year.
- From 2000 to 2009, the annual import volume averaged 11.8 million pounds.
- The mean import volume from 2010 to 2018 reached 15.0 million pounds.
- After the start of the U.S.-China trade war in July 2088, the total U.S. import volume of crawfish fell to 11.5 million pounds per year.

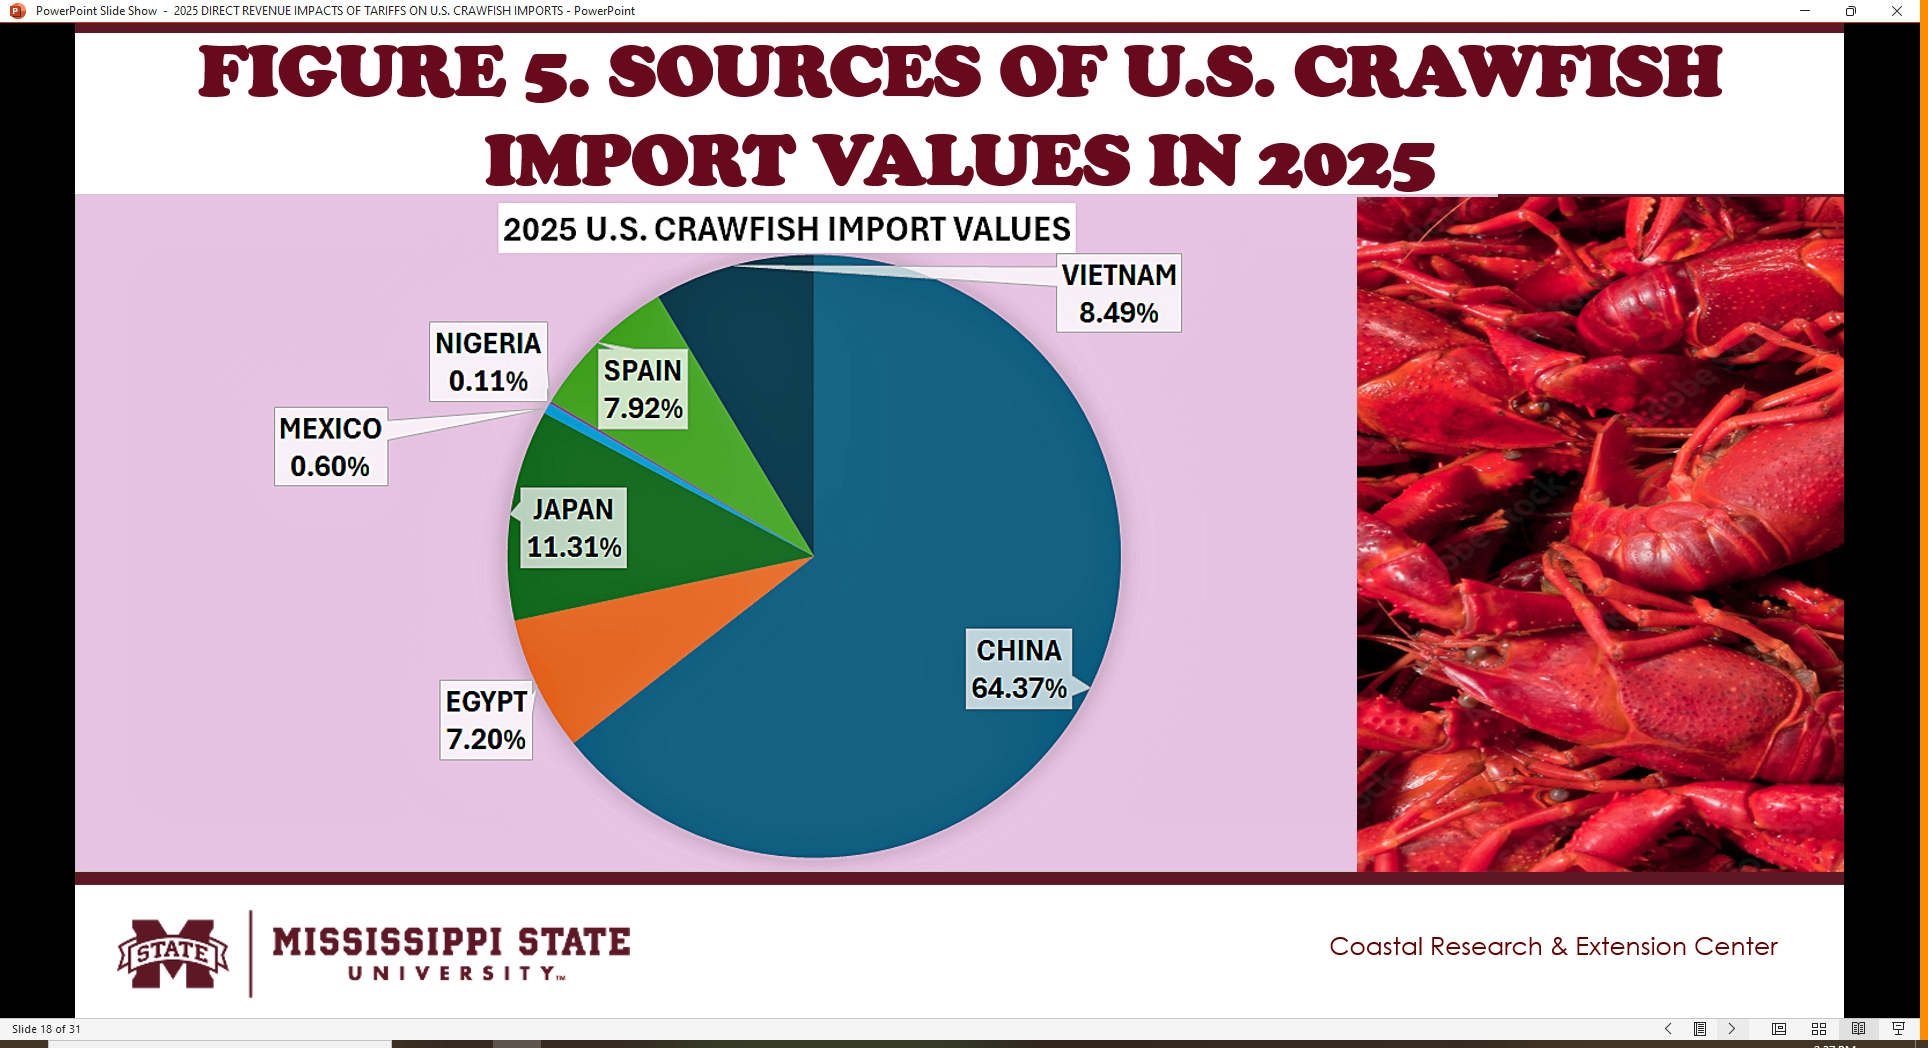
SOURCES OF U.S. CRAWFISH IMPORT VALUES
- Fig. 3 to 5 show the major sources of total U.S. crawfish imports in 2018, 2024 and Jan-Mar 2025.
- China supplied 85.61% of U.S. crawfish imports in 2018.
- The U.S. China trade war since 2018 reduced China’s share to 65% in 2024 and 64.37% in 2025.
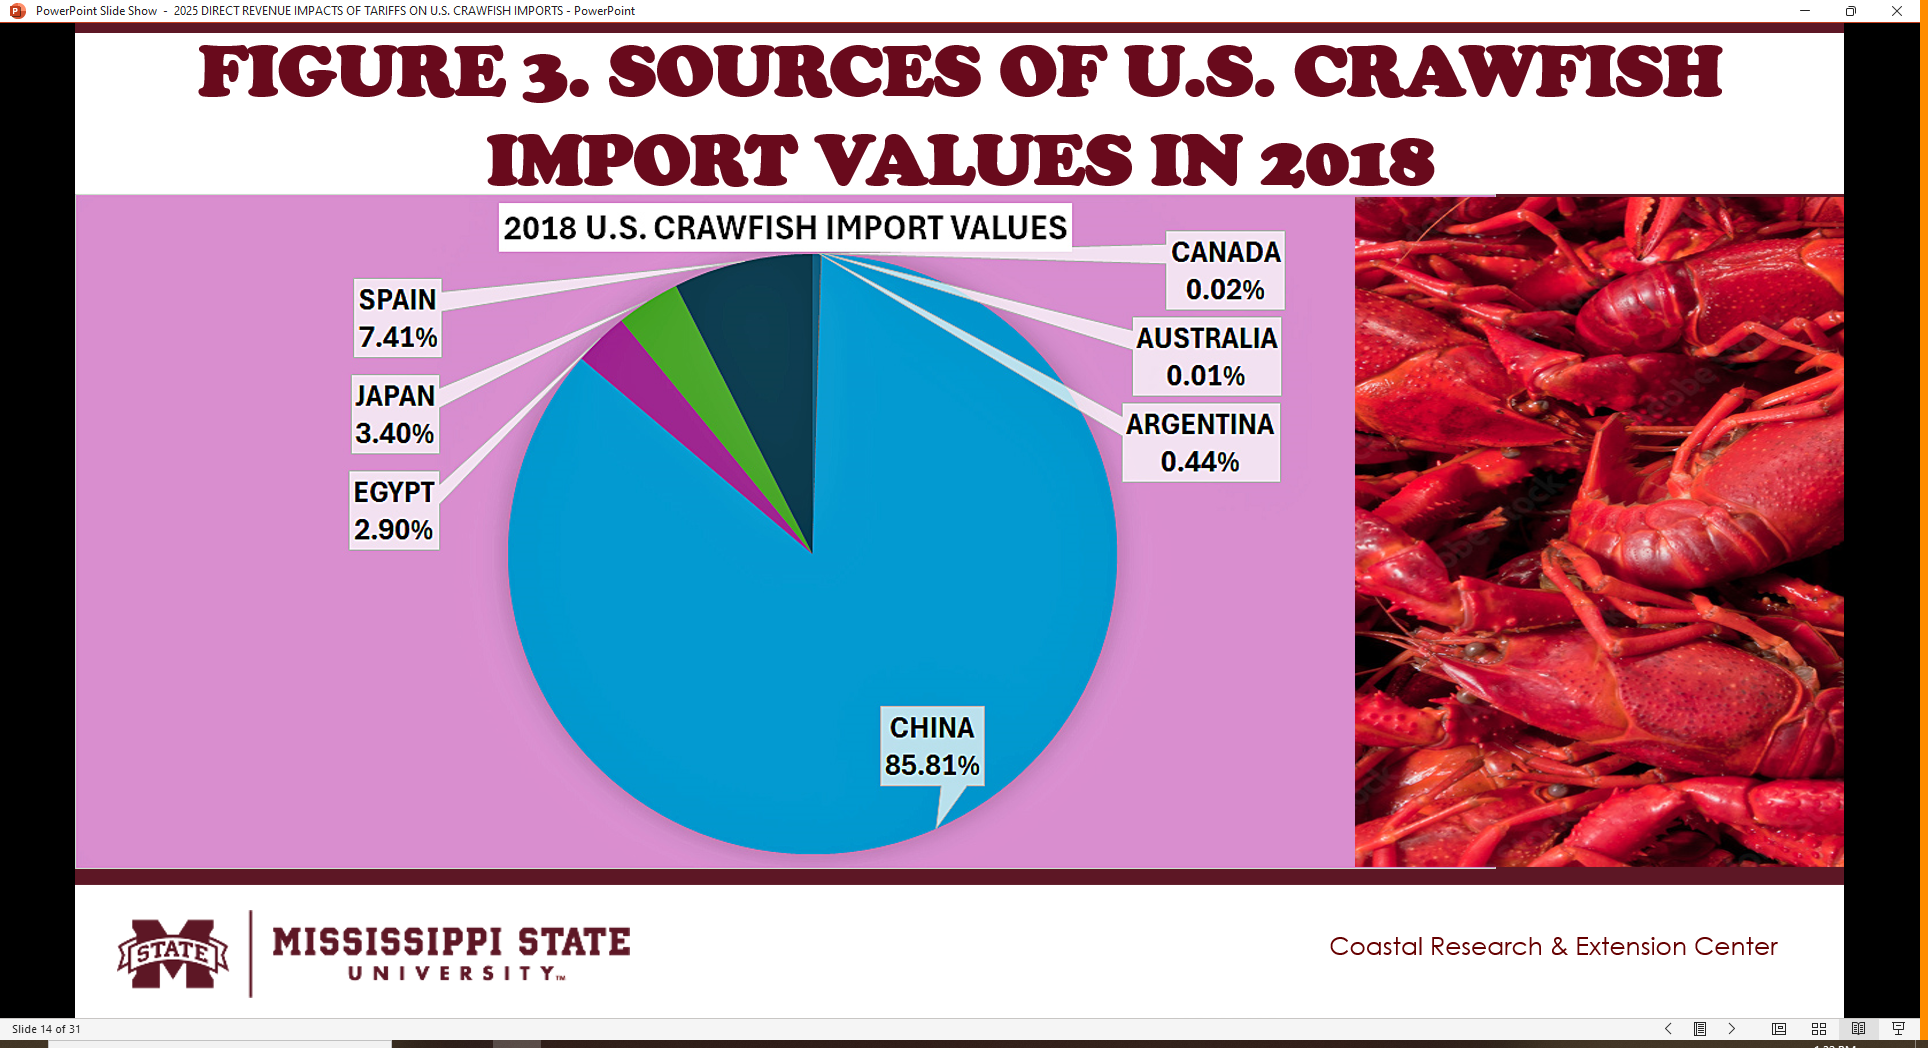
- Spain supplied 7.41% of U.S. crawfish imports in 2018, 8.16% in 2024, and 7.92% in 2025.
- Japan exported 3.4% in 2018 of U.S. crawfish imports, 9.61% in 2024 and 11.31% 2025.
- Egypt provided over 7.2% of U.S. crawfish imports in 2025, 11.69% in 2024, and almost 2.9% in 2018.
- Vietnam share rose to 8.49% of U.S. crawfish imports in 2025, and 5.07% in 2024.

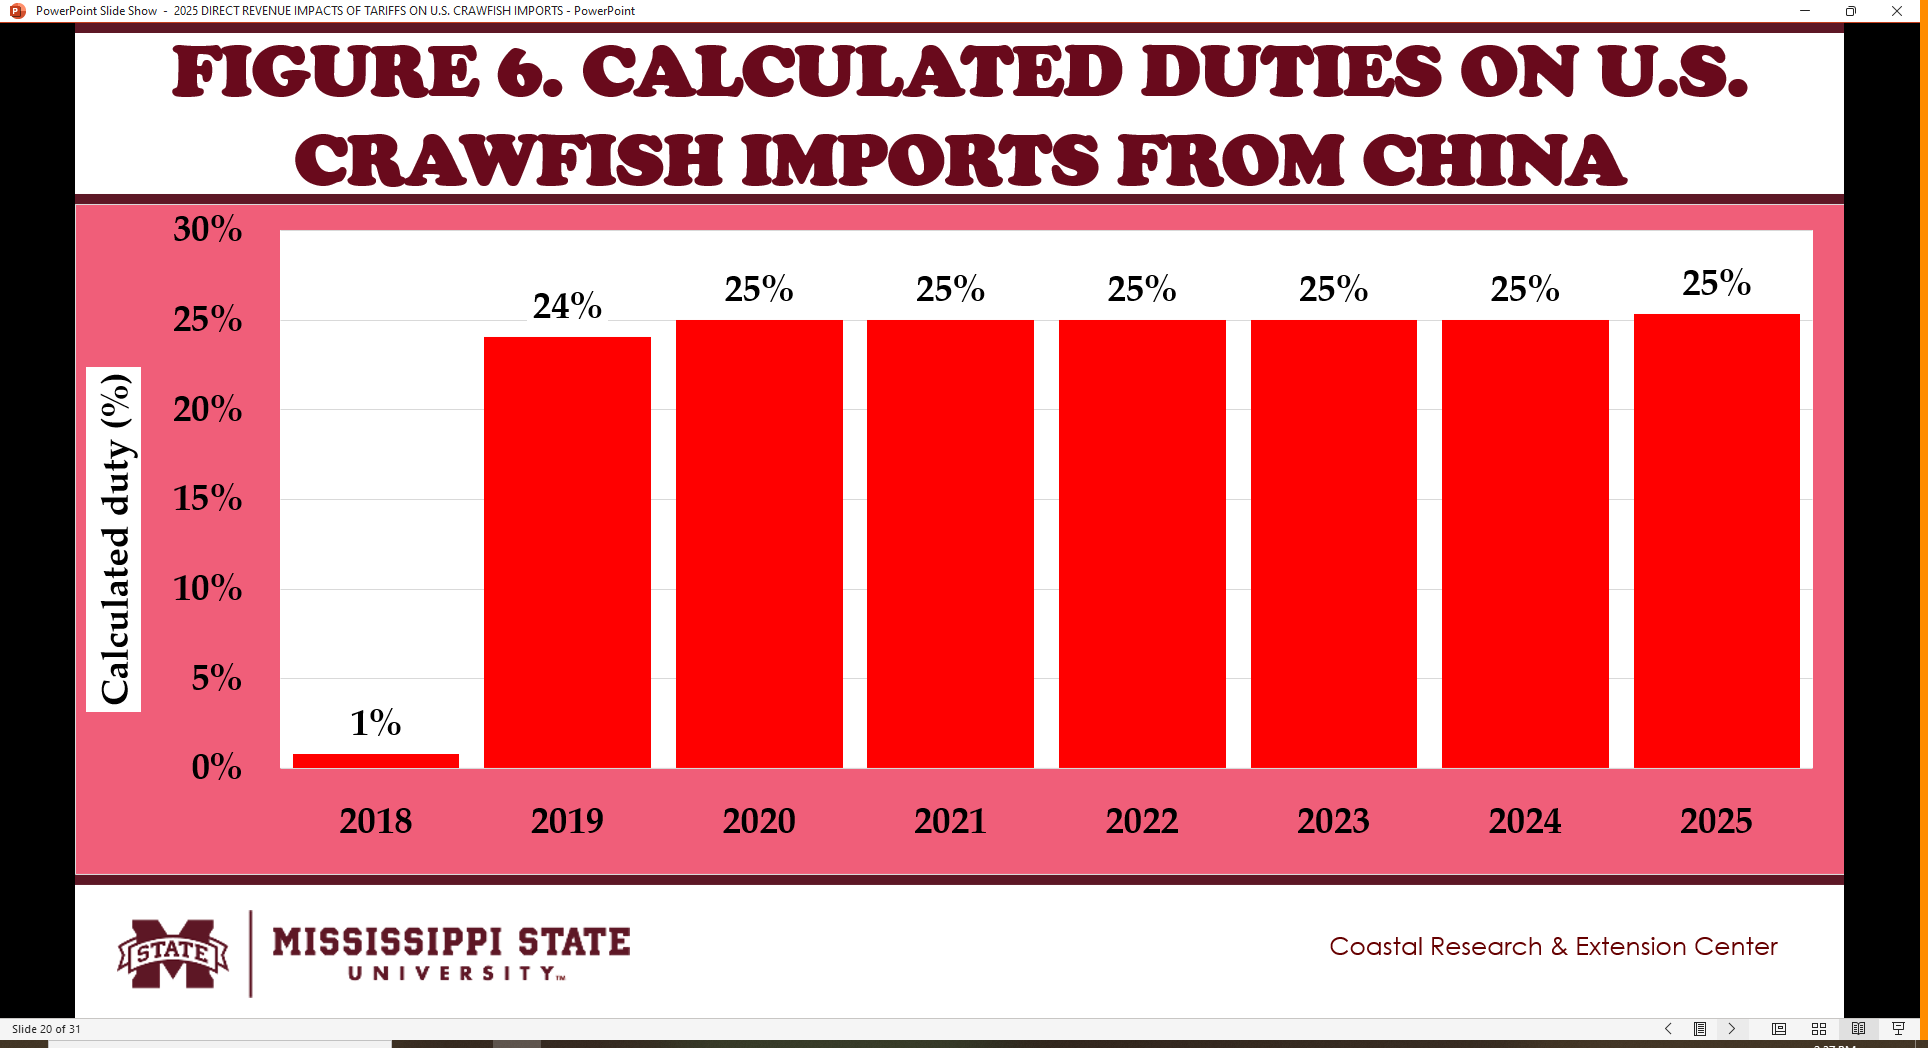
CALCULATED DUTIES ON THE U.S. CRAWFISH IMPORTS FROM CHINA
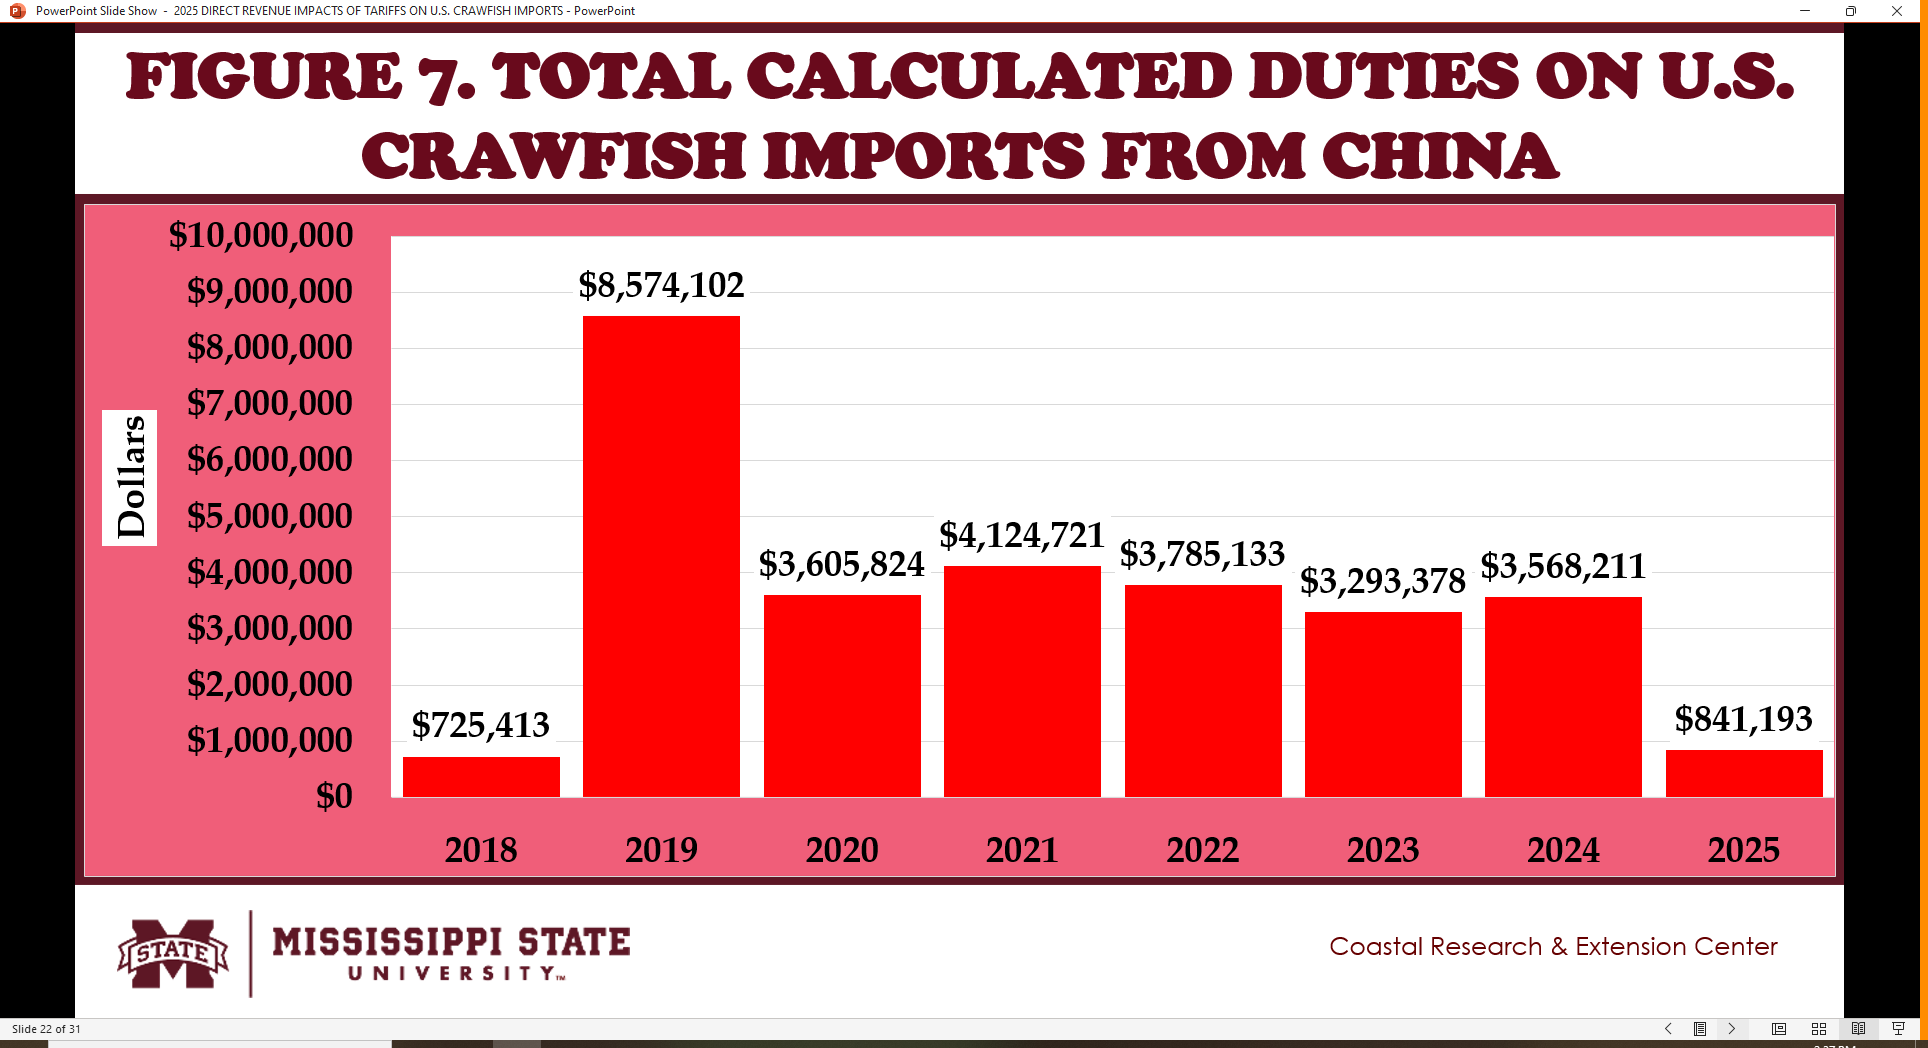
- Fig. 6 and 7 show the calculated duties on the U.S. crawfish imports from China since 2018.
- China supplied 86% of U.S. crawfish imports in 2018. The U.S. China trade war since 2018 reduced China’s share to 65% in 2024 and 2025.
- Calculated duties of 25% were imposed on U.S. crawfish imports from China since 2019 (Fig. 6).
- In 2019, a total of $8.6 million were collected as duties on U.S. crawfish imports from China (Fig. 7).
- As the value of U.S. crawfish imports from China fell, the annual calculated duties also declined from 2020 to the present.
IMPUTED PRICES OF U.S. CRAWFISH IMPORTS
- Fig. 8 shows the nominal imputed prices U.S. crawfish imports since 1989.
- From 1989 to 2008, the nominal import prices were at about or below $3.00 per pound.
- The nominal import prices rose above $4.00 per pound from 2009 to 2018.
- Then the nominal imputed prices U.S. crawfish imports started to fall in 2019 and stayed below $2.00 per pound from 2022 to 2025.

IMPUTED PRICES OF THE U.S. CRAWFISH IMPORTS FROM CHINA, 2018-25
- Fig. 9 shows the scatter diagram between deflated imputed prices and calculated duties on U.S. crawfish imports from China since 2018.
- The empirical relationship indicates that deflated imputed prices were lower at higher calculated duties on U.S. crawfish imports from China since 2018.
- These results indicate that the tariff burdens on U.S. imports of crawfish from China are absorbed mostly by Chinese exporters and not much by U.S. importers.

IMPUTED PRICES OF TOTAL U.S. CRAWFISH IMPORTS, 1989-2025
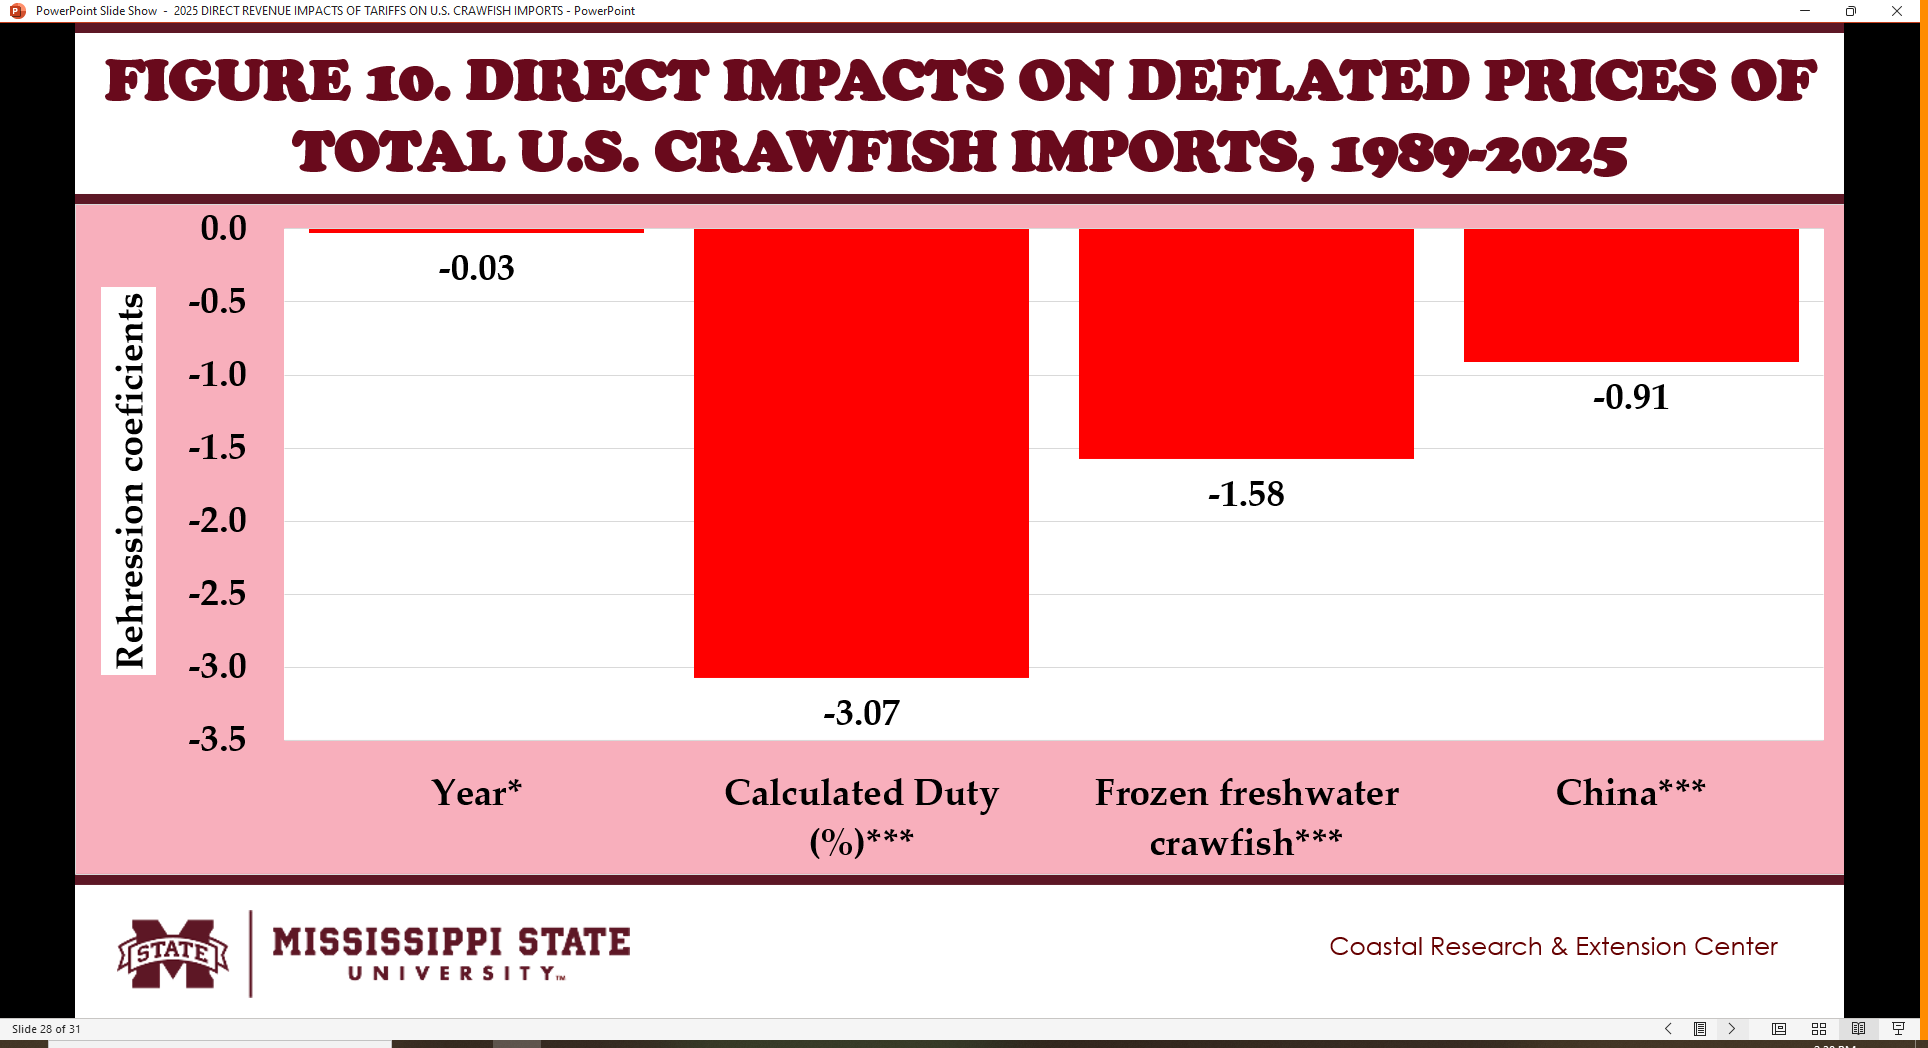
- Fig. 10 shows the results of the econometric model on deflated imputed prices of U.S. crawfish imports.
- Deflated import prices of U.S. crawfish imports fell over time.
- Deflated import prices of U.S. crawfish imports declined at higher calculated duties.
- Deflated import prices of U.S. crawfish imports are lower for frozen crawfish as compared to frozen peeled crawfish.
- Deflated import prices of U.S. crawfish imports are lower for imports from China.
SUMMARY, LIMITATIONS AND IMPLICATIONS
- China supplied 86% of U.S. crawfish imports in 2018.
- The U.S. China trade war since 2018 reduced China’s share to 65% in 2024 and 2025.
- Japan provided 11% of U.S. crawfish imports in 2025, almost 10% in 2024, and over 3% in 2018.
- Spain sold almost 8% of U.S. crawfish imports in 2025, over 8% in 2024, and over 7% in 2018.
- Deflated prices of U.S. crawfish imports fell over time, lower at higher calculated duties, lower for frozen crawfish as compared to frozen peeled crawfish, and lower for crawfish imported from China.
ACKNOWLEDGEMENT
- This newsletter is a contribution of the Mississippi Agricultural and Forestry Experiment Station and the Mississippi State University Extension Service. This material is based upon work supported in part by the National Institute of Food and Agriculture, U.S. Department of Agriculture, Hatch project under accession number 100004. Any opinions, findings, conclusions, or recommendations expressed in this publication are those of the author. They should not be construed to represent any official USDA or U.S. Government determination or policy.
- This work was supported in part by the Mississippi-Alabama Sea Grant Consortium, National Oceanic and Atmospheric Administration, U.S. Department of Commerce, and the states of Alabama and Mississippi—federal grant number NA24OARX417C0155-T1-01. The statements, findings, conclusions, and recommendations are those of the authors and do not necessarily reflect the views of any of these funders.
SUGGESTED CITATION
- Posadas, B.C. 2025. Direct Revenues from Tariffs and their Impacts on Prices of U.S. Crawfish Imports. Vol. 15, No. 7. Mississippi State University Extension and Mississippi-Alabama Sea Grant Publication MASGP-25-058-7. July 2, 2025. Mississippi MarketMaker.
ADDITIONAL MATERIALS
- Posadas, Benedict C. 2025. 2025-16 Tariffs on U S Crawfish Imports: Direct Revenues and Impacts on Prices. Informational virtual presentation. Horticulture and Marine Economics Outreach, Vol. 2025, No. 16. Mississippi State University, Coastal Research and Extension Center, Biloxi, MS. YouTube Video.


