Grading Hardwood Trees: A Guide to Identifying Stem Quality in Hardwood Stands
Many forest landowners in Mississippi own hardwood stands but are often unaware of the great differences in quality and value among individual trees within these stands. Tree (or log) grade is essential in determining the quality and economic value of hardwood trees. This publication will explain tree grading in a simple, straightforward manner that you can learn with practice.
Why Should You Grade Your Trees?
Grading provides the best method of estimating wood quality of a standing tree both now and in the future. Potential monetary value of the tree can be established using this information. If a landowner is interested in timber production, maintaining higher grade trees is important. The reasoning is simple: high-grade trees are much more valuable than low-grade trees. If a forest landowner is interested in economic return, tree grade is as important as tree volume in determining the rates of return in hardwood stands.
What Is Tree Grade?
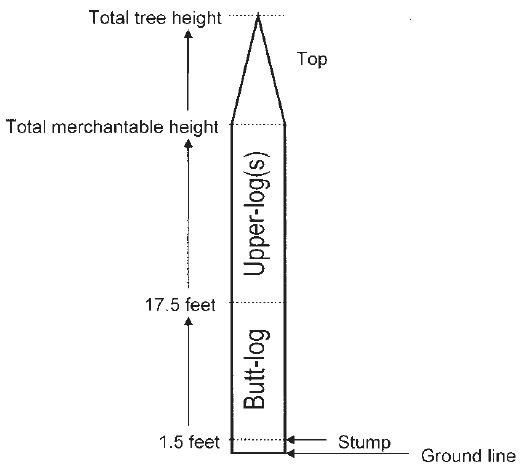
Tree grade is a measurement used to express the wood quality of a tree. Grade is determined using the amount of clear wood (defect-free stem length) within the buttlog portion of a tree (Figure 1). The butt-log of a tree is the lowest 16-foot section above the stump height (approximately 1.5 feet). Though upper logs may be graded on the sawmill yard, butt-logs are generally used to establish standing tree grade because this portion contains the majority of a tree’s economic value. In addition, visual grading from the ground becomes increasingly difficult above the butt-log. Therefore, this publication will reference tree grade as butt-log grade only. Since grade is the determining factor in establishing the quality of sawtimber a tree may produce, grades are typically assigned to sawtimber-sized trees (those with diameter at breast height—DBH or 4.5 feet above ground—of greater than 12 inches).
Field Grades
Three field grades are used to rank the quality of tree logs: F1, F2, and F3. An F1 tree grade represents a stem with the potential to produce a high percentage of high-quality wood. This means that F1-grade trees will produce a large proportion of wood that can be used for higher value wood products like furniture, flooring, dimensional lumber, and other high-value products. An F2 tree grade represents a stem capable of producing some high-quality wood but not enough to be ranked as an F1 grade. An F3 tree grade represents a stem capable of yielding only a small percentage of high-quality wood. F3-grade stems are often used for equipment mats as well as pallet or container material. If a sawtimber tree will not yield enough quality wood to make an F3 grade, it is classified as “no grade” and will be used for pulpwood, tie logs, and other lower value products. It might also be determined “non-merchantable” (or cull), meaning it has no economic value.
Components of Tree Grade
Tree Size
One of the most important aspects of tree grading is tree DBH. There are differing minimum DBH sizes required for a tree to be considered an F1, F2, or F3 grade. For example, a tree must have a DBH of at least 16 inches to be a candidate for an F1 grade, at least 13 inches for an F2 grade, and at least 10 inches for an F3 grade.
Also, based on DBH, varying lengths of clear wood (defect-free sections) are required to make a specific tree grade. For example, a tree with a DBH of 20 inches must have two clear sections of wood that are each a minimum of 5 feet in length to qualify as an F1 grade. However, a 16-inch DBH tree would need two clear sections of wood that are each a minimum of 7 feet in length to qualify for the same grade. Essentially, smaller diameter trees require longer lengths of clear wood to make a grade.
Scaling Diameter
Scaling diameter (SD) is another measure used in tree grading. SD is defined as the diameter inside bark (dib) at the small (or top) end of a tree log. It is used to determine the amount of wood that can be extracted from a log. Obviously, this measurement is difficult to obtain on standing trees; therefore, when calculating SD, assume it is equal to 80 percent of tree DBH (Table 1). For example, a tree with a 20-inch DBH would have a 16-inch SD (20 × 0.80 = 16). The 80 percent assumption refers to “form class,” which is the ratio between DBH and SD. Most sawtimber-size hardwood trees have a form class near 80 percent.
Table 1. Estimated scaling diameter for form class 80 trees.
|
DBH (inches) |
SD (inches) |
|
12 |
9.6 |
|
13 |
10.4 |
|
14 |
11.2 |
|
15 |
12.0 |
|
16 |
12.8 |
|
17 |
13.6 |
|
18 |
14.4 |
|
19 |
15.2 |
|
20 |
16.0 |
|
21 |
16.8 |
|
22 |
17.6 |
|
23 |
18.4 |
|
24 |
19.2 |
|
25 |
20.0 |
|
26 |
20.8 |
|
27 |
21.6 |
|
28 |
22.4 |
|
29 |
23.2 |
|
30 |
24 |
Grading Faces
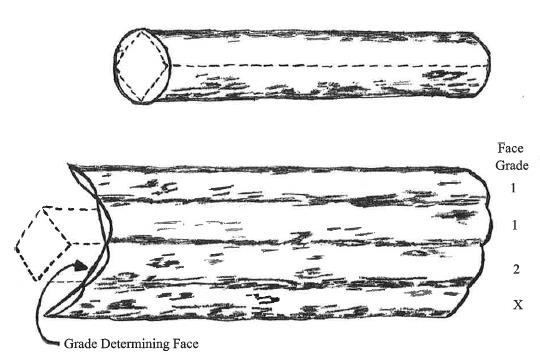
Establishing grading faces is key to properly determining tree grade. Four equal sections (called faces) are established by dividing the butt-log vertically (Figure 2). The first face is established by placing as many defects as possible into one grading face. This grading face becomes the “worst face” because it contains the highest proportion of tree defects and the least amount of clear wood. It is very important to concentrate as many defects as possible on this face to ensure the highest grade possible on remaining faces. Improper setting of grading faces can result in lower overall tree grade. Grade reduction will result in lower butt-log value and could inappropriately influence future forest management. The remaining three grading faces are established by vertically dividing the remainder of the butt-log into three equal sections. It is important to note that the second-worst grading face of the butt-log will establish the tree grade.
Tree Defects
The ability to identify tree defects is essential to accurate tree grade establishment. Defects can include knots, epicormic branches, decay, fractures, and/or crook and sweep. Tree defects directly affect tree grade by reducing the length of defect-free stem sections in the butt-log.
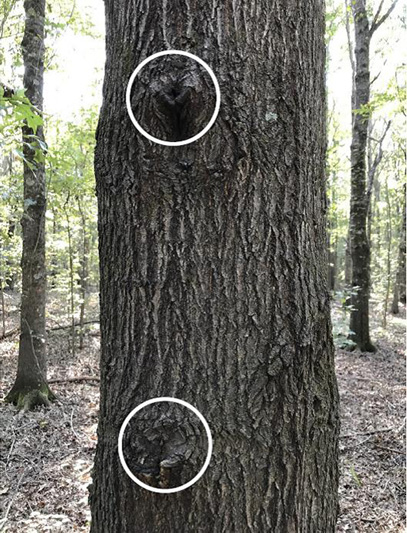
- Knots: Knots are the most typical defect found on hardwood logs. Knots can best be described as remnants of old limbs (Figure 3). As a forest stand develops, some of the lower tree limbs are shaded, eventually die, and prune (fall off) given sufficient time. However, at the point on the trunk where the limb was attached, a knot remains. Knots are counted as defects, because the wood is affected all the way to the core of the stem.
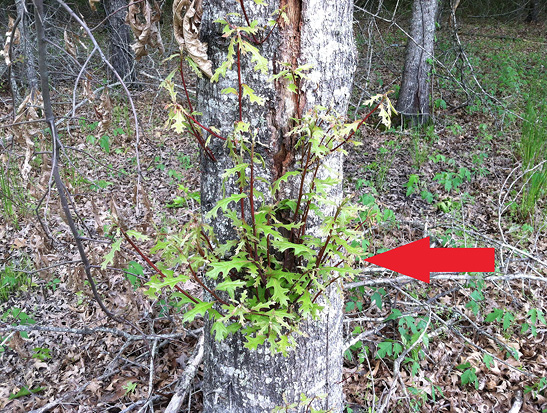
- Epicormic branches: Hardwood trees contain dormant buds all along their trunks. Under certain conditions (such as elevated light levels, environmental stress, and others), these buds are triggered to sprout a new limb on the trunk of a tree. These new limbs are called “epicormic branches” (Figure 4), and timber buyers will typically lower the tree grade if epicormic branching is present. However, epicormic branching may not result in an actual lowering of wood quality as is often presumed. In most cases, the majority of epicormic branches occur above the butt-log of a tree (remember the butt-log contains most of the economic value). Also, epicormic branches must be at least 3/8 inch in diameter before they can be considered a defect. Smaller epicormic branches will slab off without lowering wood quality during mill operations. On trees with an SD under 14 inches, every epicormic branch greater than 3/8 inch is considered a defect. On trees with an SD of 14 inches or larger, every other epicormic branch greater than 3/8 inch is considered to be a defect.
- Stress fractures: Stress fractures may include frost cracks, seams, or splits. The major determination that must be made with stress fractures is how deep they extend into the interior of the trunk. For stress fractures that extend into the interior of the trunk, count the length affected as a defect.
In standard log grading, crook, sweep, and decay are handled by one of two methods:
- Use a series of formulas derived by the USDA Forest Service based on length and severity of the defect.
- Simply reduce the length of the log so that it does not include the portion with the defect (for grading purposes, a log must be at least 12 feet long). For simplicity, this publication will only demonstrate the formula for sweep. Crook and decay will be handled by reducing log length to exclude defects.
- Decay: Decay or rot may result from several factors, but it is always a defect. Decay may be initiated by fire damage, insects, disease, mechanical logging damage, and/or other factors. In standing trees, it may be difficult to determine the area of the trunk affected by decay because only exterior damage can be viewed. When establishing the length of the trunk affected by decay, a measure of the length of the exterior decay and an estimate of the length of interior decay should be determined. Sometimes hollow decayed portions of logs can be sounded using a hammer or other tool. This portion of the log should be excluded, if possible, and the resulting shorter log should then be graded.
- Sweep and crook: Sweep and crook refer to different types of butt-log curvature. Sweep describes the curve in a log from its base to top. Estimating sweep can be difficult, but it is easier to calculate with a little background knowledge. For log grading, sweep percentage is calculated. First, determine actual inches of sweep (determined by imagining a straight log and measuring the difference between a straight log and the actual log) and subtract one of three constants determined by log length. These constants are 1 for logs 8–10 feet long, 1.5 for logs 11–13 feet long, and 2 for logs 14–16 feet long. After determining sweep by subtracting this constant, divide inches of sweep by DBH (Figure 5). Crook is similar to sweep except that a portion of the log is straight and turns at one end (Figure 6). As noted earlier, this publication assumes the crooked portion is not included and the resulting shorter log is graded. If more than 4 feet of the log are affected by a significant crook, the log is probably not gradable and should be considered a pulp, tie, or cull log.


Clear Cuttings
Clear cuttings are sections of clear wood or defect-free stem in a grading face (Figure 8). These sections are used to establish the grade of a particular face. Two primary considerations are important when evaluating clear cuttings: 1) the number of cuttings present and 2) the length of each cutting. This information is used in Table 2 to establish tree grade.
Cumulative Length of Clear Cuttings
The cumulative length of clear cuttings is the final and most important component necessary to establish tree grade. Cumulative length is simply the sum of clear cutting lengths within a single grade face. There are different requirements for this measurement based on grade (F1, F2, or F3), log length (12, 14, or 16 feet), and diameter. Determining cumulative length of clear cuttings is described in more detail in the next section.
Steps to Determining Tree Grade
- Establish the butt-log: Establishing the butt-log of a tree is a simple process. First, determine stump height. For most trees, this will be within 1.5 feet off the ground. Exceptions may occur if a tree has a large amount of swell at the base or if a split trunk is present (Figure 7). For trees with normal taper, simply measure or estimate 17.5 feet from the ground to establish the butt-log (Figure 1). If a tree contains swell or a split trunk, the butt-log will be the first 16 feet above the defect. For grading purposes, it is recommended that the larger of two split stems is graded.
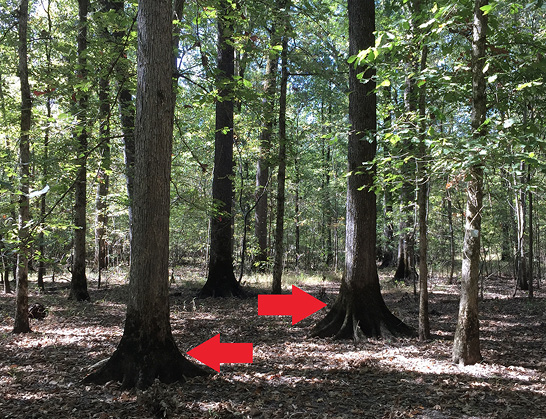
- Determine scaling diameter: As described earlier, scaling diameter (SD) is the diameter inside bark (dib) of a log at the top end (small end). For standing trees, this measure must be estimated using a form class.
- Measure DBH (use a Biltmore stick, diameter tape, or estimate diameter).
- Multiply DBH by form class (80%) or use Table 1. Example: DBH = 20 inches; SD = 20 × 0.80 = 16 inches; 16 inches would be the scaling diameter used in Table 2.
- Establish four grading faces:
- Find the vertical quarter section of the butt-log containing the most defects.
- This quarter section is the worst grading face
- Establish remaining three grading faces (Figure 2).
- Remember, grading faces must be equal in size and will differ depending on tree size.
- Find the vertical quarter section of the butt-log containing the most defects.
- Determine number and length of clear cuttings on each face:
After establishing the worst grading face (fourth face) and the remaining three grading faces, determine the number of clear sections and their respective lengths. The worksheet in Example 1 will help explain these measurements. In Example 1, marks are placed on the worksheet to represent defect locations. Clear wood sections are established as areas between defects. In actual practice, defect location should be recorded as accurately as possible. Failure to record defects in their correct locations can cause extreme variations in calculated tree grade accuracy. In Example 1, Grade Face 3 has defects located at 4, 9, and 13 feet above the stump. This grading face contains four sections of clear wood. Section 1 is 3 feet in length, Section 2 is 4 feet in length, Section 3 is 3 feet in length, and Section 4 is 3 feet in length.
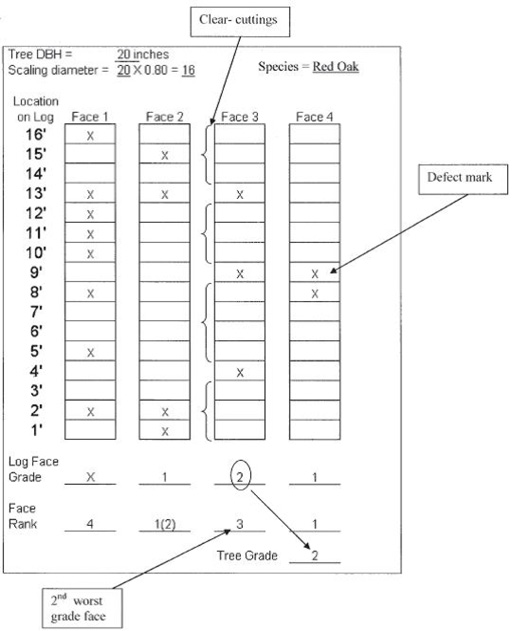
- Determine second-worst face (grade of second-worst face is tree grade): Using Example 1, input that information into Table 2, and grade and rank the grading faces. Table 2 incorporates all measurements necessary to determine grade of a particular grading face.In Example 1, Face 3 was ranked as the second-worst face, meaning that this would be a grade F2 tree. Consequently, it would possess fair market value for its volume as an F2-grade red oak. Face 3 contains four clear sections of wood, with lengths of 3, 4, 3, and 3 feet, respectively. This information is used in Table 2 to determine face grade. In order to make grade F1, Face 3 would be required to have two or fewer clear wood sections at least 5 feet in length totaling 10 or more cumulative feet for a 12-foot section (11.7 feet for a 14-foot section or 13.3 feet for a 16-foot section). These requirements restrict Face 3 from being an F1-grade face. Subsequently, the requirements for grade F2 are checked. In order to make a grade F2, Face 3 (SD = 16 inches) must contain 8 total feet of clear wood in a 12-foot section (9.3 feet in a 14-foot section or 10.7 feet in a 16-foot section). The 8 feet of clear wood can be accumulated using a maximum of three clear cuttings at least 3 feet in length each. The first 12 feet in Face 3 contain a 3-, 4-, and 3-foot section, totaling 10 feet in length. Therefore, Face 3 is an F2 grade. When working with Table 2, always start at grade F1 and work down to the highest grade a face will make. A sample tally sheet is provided at the end of this publication.
F1 Grade Example
Figure 8 demonstrates the traits of an F1-grade, 16-foot section of a butt-log. Assume DBH is 26 inches. The SD would be 26 × 0.80 = 20.8 inches. Also assume the grading section in Figure 8 represents the second-worst face. This face contains two clear sections of wood that are 8 and 7 feet long. Using Table 2, to make an F1 grade, the face would need 13.3 total feet in two or fewer sections that are at least 3 feet long. Since this face meets these requirements and it is the second worst face, the tree is an F1-grade tree. This example demonstrates that the size of a tree greatly affects its ability to be an F1 grade. A very important consideration for large-diameter trees is that if they are old trees (> 80 years), they may be hollow in the center, which degrades and devalues the tree.

F2 Grade Example
Figure 9 demonstrates the traits of an F2-grade, 12-foot section of a butt-log. DBH is 16 inches, so SD would be 16 × 0.80 = 12.8 inches. Assume the grading face in Figure 9 represents the second-worst face. This face contains three clear sections of wood that are 3, 4, and 3 feet long. Using Table 2, to make an F1 grade, the face would need 10 total feet in two or fewer sections that are at least 7 feet long. Since this face does not meet these requirements, it cannot be a grade F1. Therefore, grading specifications for an F2 grade should be checked. To make an F2 grade, the tree would need 8 total feet of clear wood in three or fewer sections that are at least 3 feet in length. Consequently, the tree is an F2 grade.

F3 Grade Example
Figure 10 demonstrates the traits of a 12-foot, F3-grade section of a butt-log. DBH is 12 inches, so SD would be 12 × 0.80 = 10.6 inches. Assume the grading face in Figure 10 represents the second-worst face. This face contains two clear sections of wood that are 5 and 3 feet long. According to Table 2, the minimum diameter requirements for an F1 or F2 grade are not met (neither DBH nor SD), so the tree can only be an F3 grade or lower. Using Table 2, a tree with these dimensions would need 6 total feet of clear wood in as many 2-foot or longer sections to be an F3 grade. Consequently, the tree meets the specifications to make an F3 grade.

Table 2. Standard butt-log grades for hardwood sawtimber using the best 12-, 14-, or 16-foot grading section.
|
Grading Factors |
Log Grade – Tree Grade 1 |
Log Grade – Tree Grade 2 |
Log Grade – Tree Grade 3 |
||
|
Length of grading zone (feet) |
Butt 16 |
Butt 16 |
Butt 16 |
Butt 16 |
Butt 16 |
|
DBH minimum (inches) |
16+ |
16+ |
16+ |
13+ |
10+ |
|
Scaling diameter (inches) |
13 |
16 |
20+ |
12+ |
8+ |
|
Clear cuttings – Minimum length (feet) |
7 |
5 |
3 |
3 |
2 |
|
Clear cuttings – Maximum number |
2 |
2 |
2 |
3 |
No-limit |
|
Minimum cumulative length of clear cuttings (12-foot section) (feet) |
10 |
10 |
10 |
8 |
6 |
|
Minimum cumulative length of clear cuttings (14-foot section) (feet) |
11.7 |
11.7 |
11.7 |
9.3 |
7 |
|
Minimum cumulative length of clear cuttings (16-foot section) (feet) |
13.3 |
13.3 |
13.3 |
10.7 |
8 |
|
Maximum sweep and crook allowance |
15% |
15% |
30% |
30% |
50% |
Adapted from USDA Forest Service standard grades for factory lumber logs (Rast et al., 1973).
What Does It All Mean for Me?
The process for assessing standing tree quality and assigning grades to individual trees has been covered thoroughly in this publication. Knowing tree grade can help landowners understand how the value of sawn lumber increases as wood quality increases. The standard grades of hardwood lumber and their clear cutting specifications are shown in Table 3. Value increases rapidly from the lower grades to higher grades of lumber.
Table 3. Standard hardwood lumber grades.
|
Grade |
Trade name |
Minimum area of clear cuttings required (%) |
|
Firsts and seconds |
FAS |
83.33 |
|
FAS one face |
F1F |
83.33 |
|
Select |
SEL |
83.33 |
|
No. 1 common |
1C |
66.67 |
|
No. 2A common |
2C |
50.00 |
|
No. 2B common |
3AC |
33.33 |
|
No. 3A common |
3BC |
25.00 |
Courtesy of the National Hardwood Lumber Grading Association.
While there is not a direct correlation between tree grade and lumber grade, typically, higher tree grade translates into greater percentages of higher grade sawn lumber. An example of typical yield for bottomland red oak in terms of log grade and the percentage of sawn lumber by lumber grade is shown in Table 4. Higher percentages of high-quality lumber are expected from higher grade trees. Consequently, timber buyers should offer better stumpage prices for hardwood stands comprised of higher percentages of higher grade trees.
Table 4. Lumber grade yield percentages by tree grade.
|
Tree Grade |
FAS (%) |
SEL FAS (%) |
1C FAS (%) |
2C FAS (%) |
3C FAS (%) |
Other FAS (%) |
|
F1 |
28 |
9 |
31 |
13 |
13 |
6 |
|
F2 |
7 |
5 |
33 |
21 |
27 |
7 |
|
F3 |
1 |
1 |
21 |
27 |
44 |
6 |
Adapted from Hanks et al., 1980, USDA Forest Service.
Summary
If you are managing a hardwood stand for high-quality timber products, determining standing tree grade can be a helpful tool in making economic decisions. While tree grade is important in assessing the economic value of a hardwood stand, it can also be an invaluable resource when preparing to conduct thinning operations. If you remove lower-grade trees, then you can better manage high-grade trees after thinning operations. Furthermore, tree grade is an integral component in decision models often used to evaluate management potential of hardwood stands.
There are many factors involved in determining tree grade. The key is to learn how to evaluate each of these factors and then attempt to bring them together to determine tree grade. The ultimate goal of this publication is not to make expert graders out of landowners but to provide them with some background knowledge that will allow them to make better management decisions. In addition, knowledge of the quality of their hardwood stands should serve to help protect landowners when marketing hardwood timber.
Suggested Reading
Hanks, L. F., Gammon, G. L., Brisbin, R. L., & Rast, E. D. (1980). Hardwood lumber grades and lumber grade yields for factory lumber logs. USDA Forest Service Research Paper NE-468.
Rast, D. E., Senderman, D. L., & Gammon, G. L. (1973). A guide to hardwood log grading. USDA Forest Service General Technical Report, NE1.
Taylor, A. (2009). A hardwood log grading handbook. University of Tennessee Extension. Publication 1772.
Publication 3179 (POD-01-21)
Adapted for Mississippi from Forest Landowner’s Guide to Field Grading Hardwood Trees, University of Arkansas Cooperative Extension Service, Fact Sheet A5015. Adapted by A. Brady Self, PhD, Associate Extension Professor, Forestry, and Kyle Cunningham, PhD, Associate Professor, University of Arkansas Cooperative Extension Service. Select figures illustrated by Brenda Clark, Office Associate, Forestry.
The Mississippi State University Extension Service is working to ensure all web content is accessible to all users. If you need assistance accessing any of our content, please email the webteam or call 662-325-2262.


