Vol. 12, No. 9 / Economic Impacts of Disaster Events on Gulf Shrimp Landings
Abstract
Dr. Posadas shows the long-term monthly landings of the Gulf of Mexico commercial shrimp landings since 2015. He developed and estimated economic models of the shrimp fisheries in the region. Using these models, he estimated the potential direct impacts of disaster events on commercial landings. Using the margins procedure, the model measured the individual effects of the disaster events on shrimp landings.
Suggested Citation
Posadas, Benedict C. 2022. Economic Impacts of Disaster Events on Gulf Shrimp Landings. Mississippi MarketMaker Newsletter, Vol. 12, No. 9. September 13, 2022.
Acknowledgement
This virtual presentation is a contribution of the Mississippi Agricultural and Forestry Experiment Station and the Mississippi State University Extension Service. This material is based upon work that is supported in part by the National Institute of Food and Agriculture, U.S. Department of Agriculture, Hatch project under accession number 081730 and NOAA (Office of Sea Grant, U.S. Dept. of Commerce, under Grant NA10OAR4170078, Mississippi Alabama Sea Grant Consortium).
Let Us Start Our Modeling Effort!
- We will compare commercial landings by month or between seasons.
- What happens to commercial landings during disastrous events such as major hurricanes?
- Do economic events affect commercial landings, such as recessions and trade wars?
- The global pandemic disrupted markets leading to reduced sales, employment, incomes, and expenditures.
Where Do We Get Our Data on Prices?
- Gulf of Mexico (GOM) catch data are compiled from NOAA Fisheries’ website.
- Diesel prices are compiled from the U.S. Energy Information Administration’s website.
- Dockside prices are imputed from shrimp dockside values and landings.
- Wholesale and imported shrimp prices are compiled from the Urner Barry Comtell website.
- U.S. no. 2 diesel retail prices were compiled from the U.S. Energy Information Administration website.
- Detailed trends in dockside prices of Gulf shrimp are shown in Posadas (2022b).
OLS Economic Model of Commercial Shrimp Landings
- The Ordinary Least Squares (OLS) model of the shrimp fishery assumed that commercial landings could be explained by the following:
- time (year) and month,
- input prices,
- shrimp dockside and wholesale prices, and imported shrimp prices,
- natural and man-made disasters, recessions, and the Covid-19 pandemic.
- The OLS model of the Gulf shrimp landings was estimated by using the robust variance procedure of STATA-16.
- The variation inflation factor was calculated to detect the possible presence of multicollinearity.
- The marginal impacts of disaster events were computed using the margins procedure.
- Direct fishery losses occur if current values are lower than the projected values.
Monthly GOM Commercial Shrimp Landings
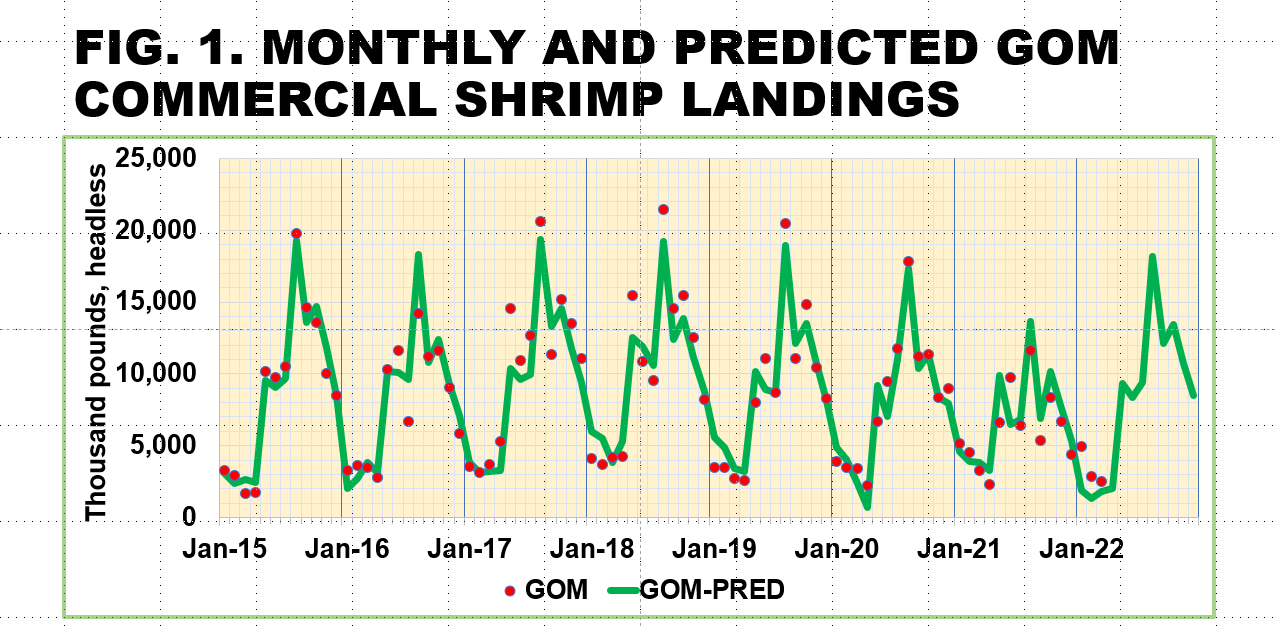
- Monthly Gulf shrimp landings from Jan. 2015 to Dec. 2022 are shown in Fig. 1.
- Data from Jan. 2015 to Mar. 2022 are actual data from NOAA Fisheries. The red dots mark these data.
- The OLS (Stata-16) generated economic model explained 91% of the variations in monthly shrimp landings.
- The estimated equation seems to fit the actual landing values well.
- The green curve marks the predicted values.
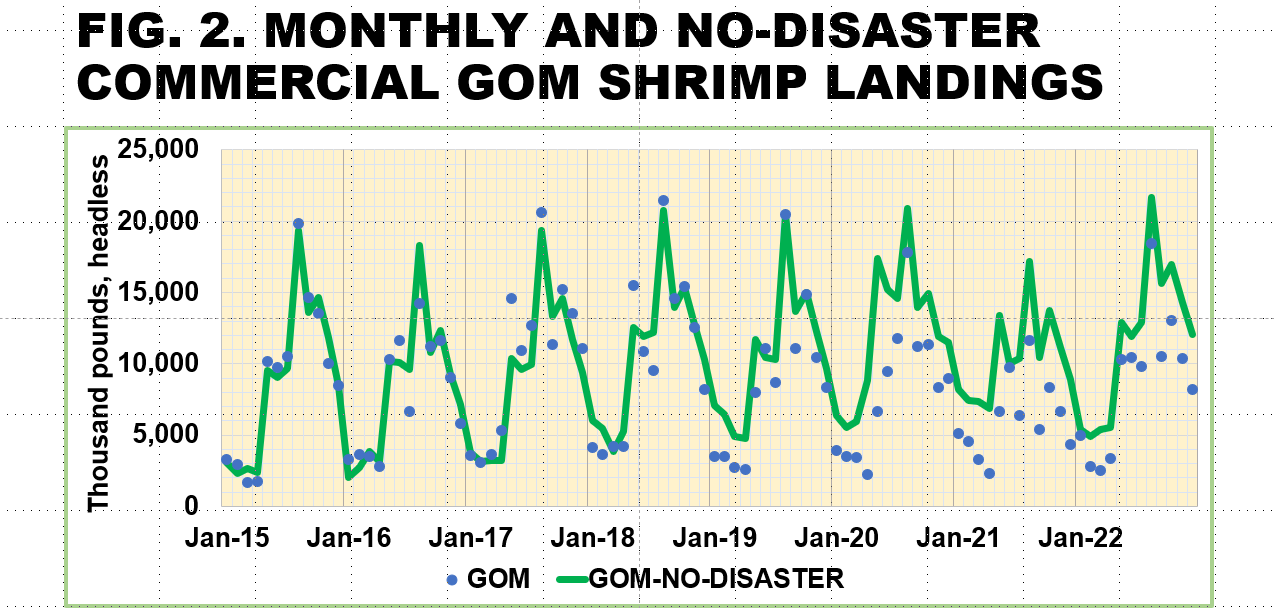
Monthly and No-Disaster Commercial GOM Shrimp Landings
- Monthly Gulf shrimp landings from Jan. 2015 to Dec. 2022 are shown in Fig. 2.
- Data from Jan. 2015 to Mar. 2022 are actual data from NOAA Fisheries. The blue dots mark these data.
- The green curve marks the predicted no-disaster values.
- Observe the swelling differences in the monthly and no-disaster projected landings starting in 2019.
- These differences in monthly and projected landings represent direct losses in shrimp landings associated with disaster events.
- Let us call these losses the GOM-OLS2 direct losses.
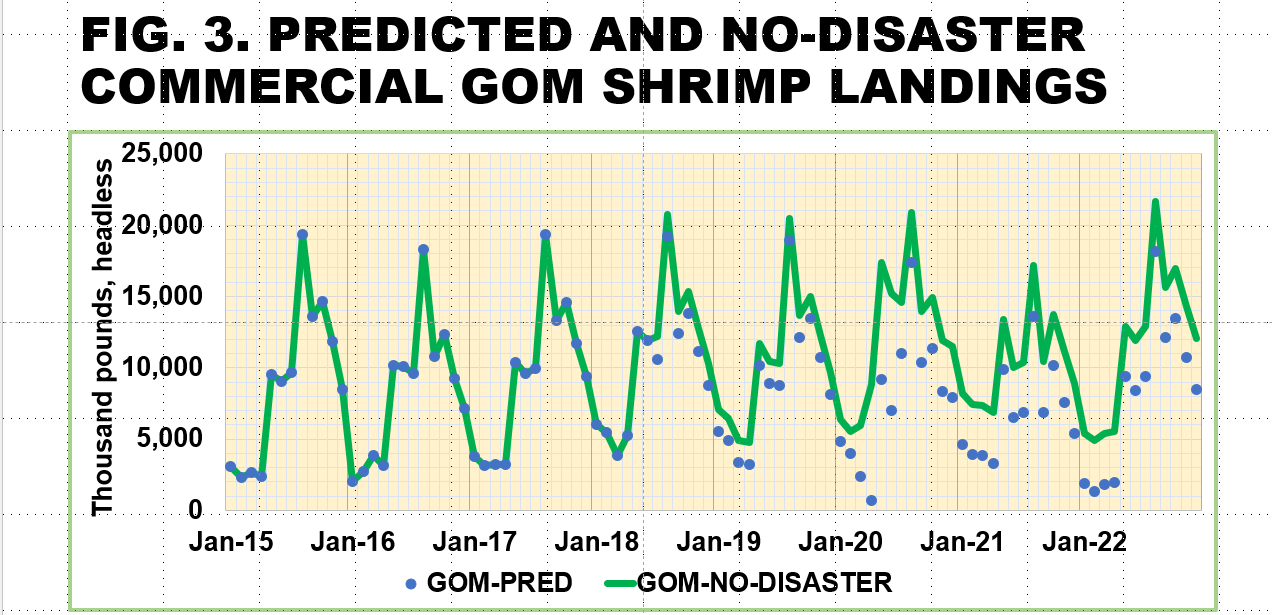
Predicted and No-Disaster Commercial GOM Shrimp Landings
- Predicted monthly Gulf shrimp landings from Jan. 2015 to Dec. 2022 are shown in Fig. 3.
- The predicted values with-disaster events are marked by the blue dots.
- The green curve marks the predicted no-disaster values.
- Observe the intensifying differences between predicted and no-disaster landings starting in 2020.
- These differences in projected landings between no-disaster and with-disaster events represent another measure of the direct losses in shrimp landings due to disaster events.
- Let us call these losses the GOM-OLS3 direct losses.
Mean-Difference Model of Commercial GOM Shrimp Landings
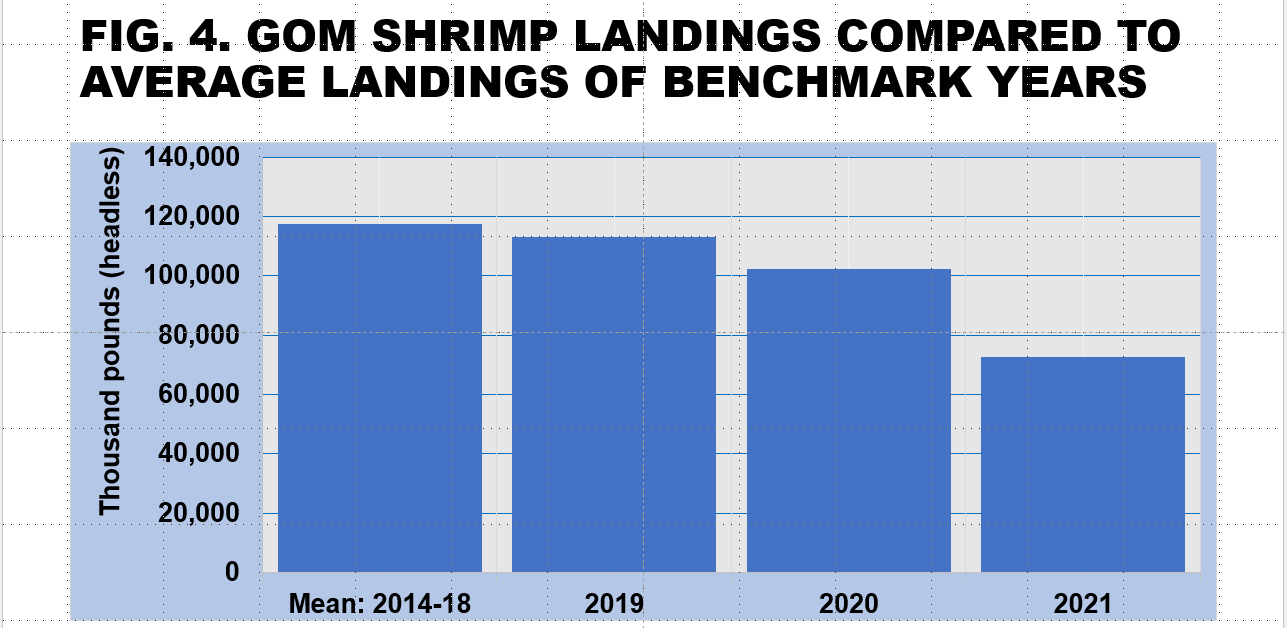
- Another approach to estimating the direct fishery losses is to compare current landings and dockside values to previous years’ benchmarks.
- The benchmark years are from 2014 to 2018 (Mean:2014-18, Fig. 4).
- Direct fishery losses occur if current values (2019, 2020, and 2021) are lower than the average benchmark values (2014-18).
- Let us call these losses the GOM-MD1 direct losses.
- GOM-MD1 direct losses in 2019, 2020, and 2021 are shown in Fig. 4.
OLS1 Direct Shrimp Losses from Jan. 2019 to Dec. 2021
- The OLS1 economic model shown in Fig. 2 estimates total shrimp losses from actual landings and predicted landings (GOM-OLS2).
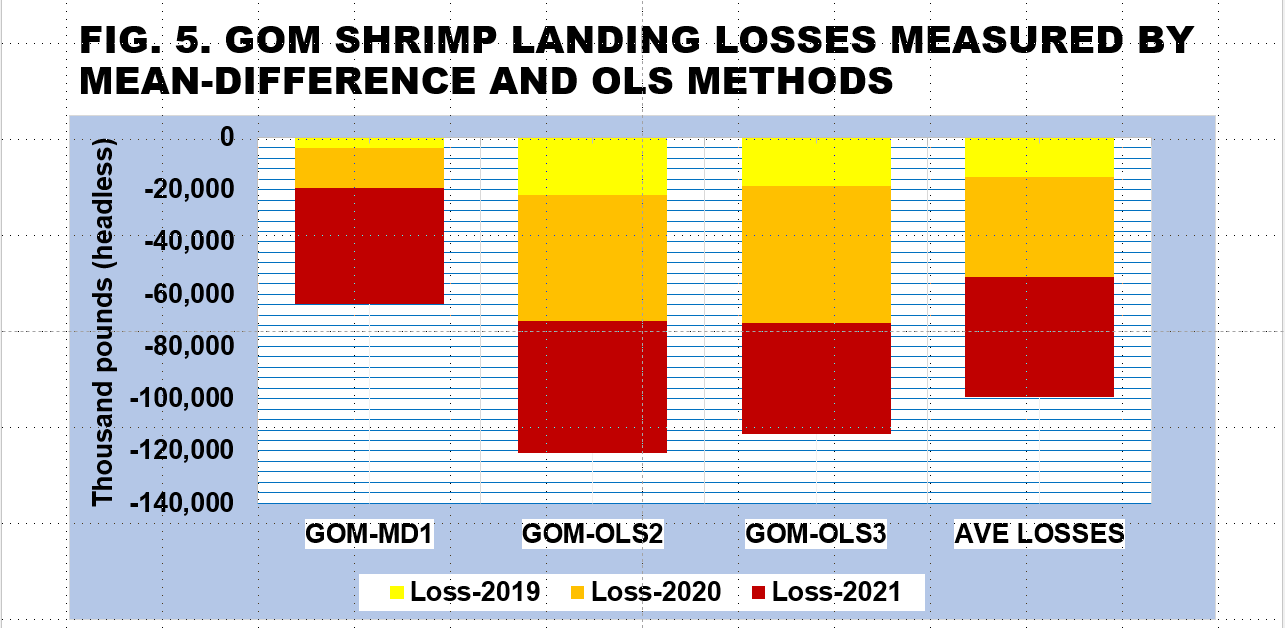
- The cumulative GOM-OLS2 direct losses from 2019 to 2021 reached 120 million pounds (headless, Fig. 5).
OLS2 Direct Shrimp Losses from Jan. 2019 to Dec. 2021
- The OLS2 economic model shown in Fig. 3 estimates total shrimp losses from predicted and no-disaster landings (GOM-OLS3).
- The aggregate GOM-OLS3 direct losses from 2019 to 2021 reached 113 million pounds (headless, Fig. 5).
Mean-Difference Direct Shrimp Losses from Jan. 2019 to Dec. 2021
- The Mean-Difference model shown in Fig. 4 estimates total shrimp losses from current landings and previous years’ benchmarks (GOM-MD1).
- The total GOM-MD1 from 2019 to 2021 estimated lower total shrimp losses reaching over 63 million pounds (headless, Fig. 5).
Summary of Direct GOM Shrimp Losses from Jan. 2019 to Dec. 2021
- On average, the direct shrimp losses from Jan. 2019 to Dec. 2021 could reach 99 million pounds (headless, Fig. 5).
Marginal Differences in Monthly Shrimp Landings
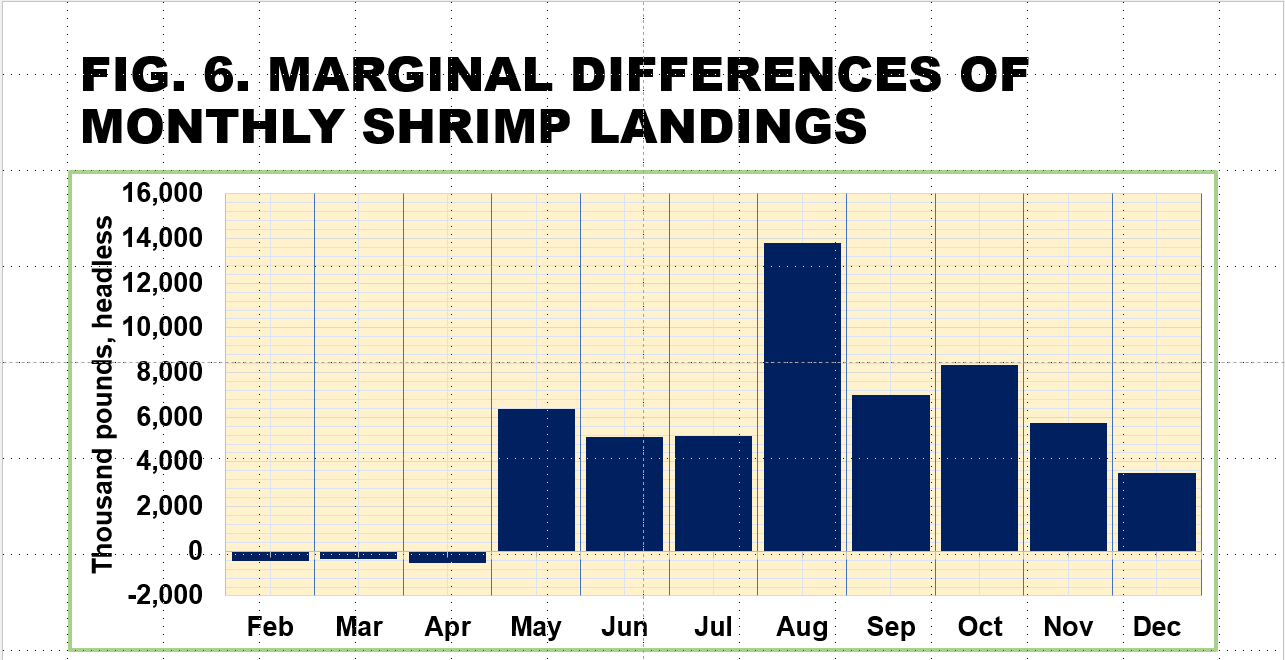
- Shrimp landings from February to April are not significantly different from January (Fig. 6).
- Shrimp landings from May to December are significantly higher than in January (Fig. 6).
- The highest shrimp landings usually occur in August (Fig. 6).
Marginal Effects of Increase of Shrimp Prices on Landings
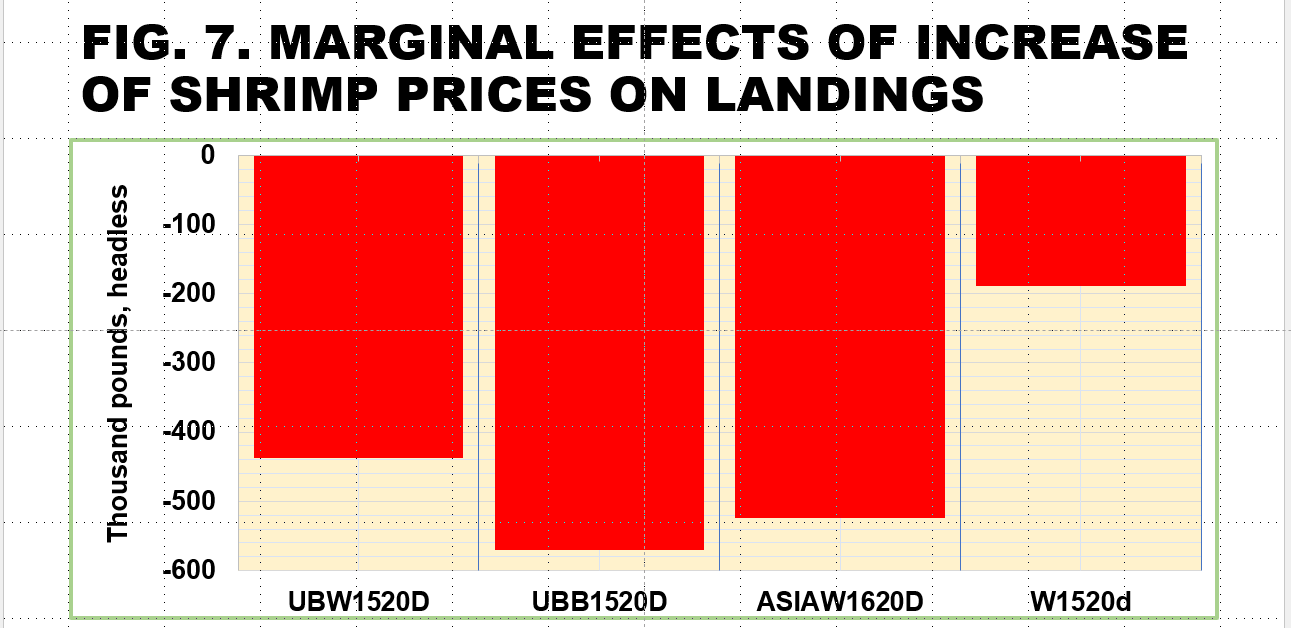
- A dollar increase in the deflated wholesale prices of 15-60 count GOM white and brown shrimp could lead to over 400,000 pounds reduction in shrimp landings (Fig. 7).
- A dollar increase in the deflated wholesale prices of 15-60 count Asian shrimp could lead to over 500,000 pounds drop in shrimp landings (Fig. 7).
- A dollar increase in the deflated prices of 15-60 count Western Gulf shrimp could lead to over 200,000 pounds decline in shrimp landings (Fig. 7).
Marginal Effects of Occurrence of Disaster Events on Shrimp Landings
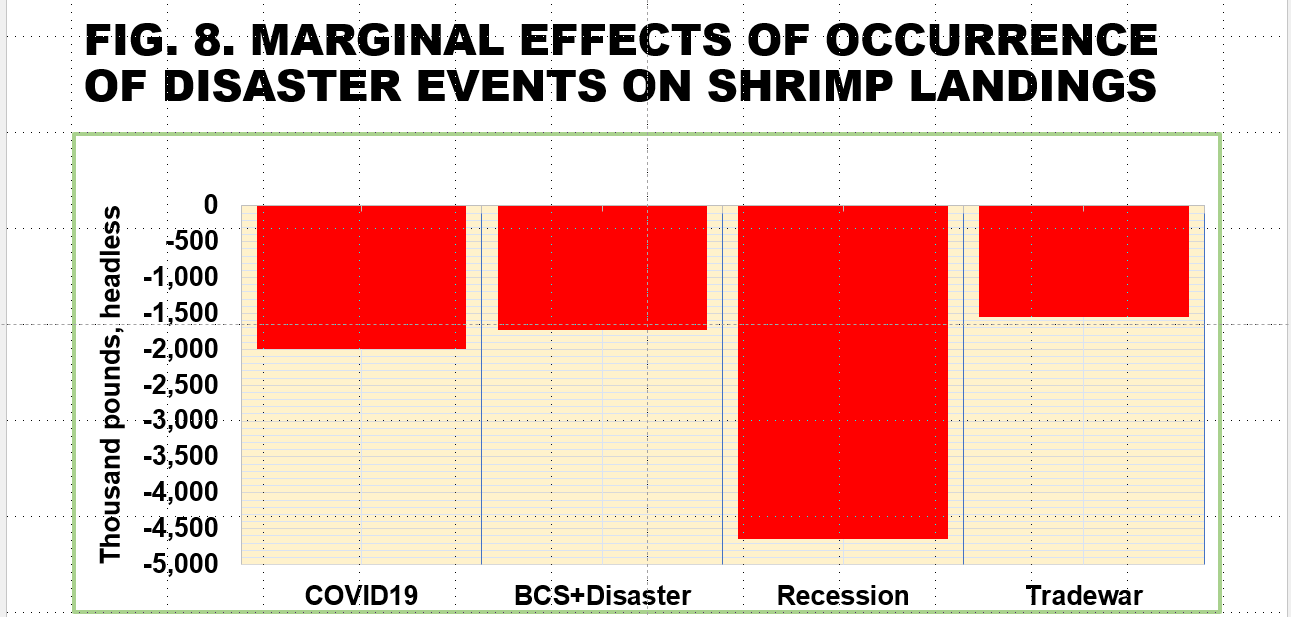
- The covid-19 pandemic, natural disasters or prolonged openings of Bonnet Carre Spillway or trade war could reduce shrimp landings by more than 1.5 million pounds (headless) per month (Fig. 8).
- Recessions could lead to a decline in shrimp landings by more than 4.5 million pounds (headless) per month (Fig. 8).
Summary of Marginal Effects on Shrimp Landings
- Shrimp landings are significantly more from May to December.
- Increases in Gulf wholesale, dockside, and Asian shrimp prices could significantly reduce shrimp landings.
- Natural and man-made disasters, the Covid-19 pandemic, and the trade war could significantly reduce shrimp landings.
My Recent Shrimp Economics Outreach
Posadas, B.C. 2022f. Impacts of Disaster Events on Commercial Shrimp Landings. HME Outreach. MSU-CREC, Biloxi, MS. (August 23, 2022).
Posadas, B.C. 2022e. Effects of Higher Fuel and Lower Dockside Prices on Gulf Shrimping. Mississippi MarketMaker Newsletter, Vol. 12, No. 8. (August 11, 2022).
Posadas, B.C. 2022d. Effects of Higher Fuel and Lower Dockside Prices on Gulf Shrimping. HME Outreach. MSU-CREC, Biloxi, MS. (August 10, 2022).
Posadas, B.C. 2022c. Impacts of the Global Pandemic on Prices of Major Mississippi Seafood Products. Mississippi MarketMaker Newsletter, Vol. 12, No. 2. (February 25, 2022).
Posadas, B.C. 2022b. Recent Dockside Prices in the Gulf of Mexico States. HME Outreach. MSU-CREC, Biloxi, MS. (April 18, 2022).
Posadas, B.C. 2022a. Price Outlook of Mississippi Seafood Products. HME Outreach. MSU-CREC, Biloxi, MS. (February 4, 2022).
Posadas, B.C. 2021. Economic Recovery Paths of the US Gulf of Mexico Shrimp Fisheries. Paper presented at the World Fisheries Congress held at the Adelaide Convention Centre in Adelaide, Australia on 20-24 September 2021.


