
Vol. 14, No. 3 / Market Potential for Cobia Aquaculture
Abstract
U.S. commercial landings and dockside values since 1950 were compiled from NOAA Fisheries. Major producing states were identified, and shifts in landings were measured. Nominal dockside prices ($/lb) are imputed from commercial landings (lb/yr) and dockside values ($/yr). Empirical commercial landings models were developed, identifying significant determinants. Retail prices compiled from Urner Barry Comtell were compared by major categories.
Keywords
Market potential, Cobia, Marine aquaculture.
Suggested Citation
Posadas, B.C. 2024. Market Potential for Cobia Aquaculture. Mississippi MarketMaker Newsletter, Vol. 14, No. 3. Mississippi State University Extension and Mississippi-Alabama Sea Grant Publication number MASGP-24-057-03. March 18, 2024. https://extension.msstate.edu/newsletters/mississippi-marketmaker.
Acknowledgement
This virtual presentation is a contribution of the Mississippi Agricultural and Forestry Experiment Station and the Mississippi State University Extension Service. This material is based upon work that is supported in part by the National Institute of Food and Agriculture, U.S. Department of Agriculture, Hatch project under accession number 081730, and Mississippi-Alabama Sea Grant Consortium using federal funds under Grant NA24OAR4170090 from the National Sea Grant Office, NOAA, U.S. Dept. of Commerce. The statements, findings, conclusions, and recommendations are those of the author and do not necessarily reflect the views of the National Sea Grant Program, NOAA, U.S. Department of Commerce. This newsletter is a Mississippi-Alabama Sea Grant Publication number MASGP-24-057-02.
Cobia
Scientific name: Rachycentron canadum
- Also known as Crabeater, Sergeantfish, Ling, Cabio, Cubby yew, Lemonfish.
- Wild-caught cobia from the United States is a smart seafood choice because it is sustainably managed and responsibly harvested under U.S. regulations.
- Source: https://www.fisheries.noaa.gov/species/cobia.
Status of Cobia Aquaculture
- Cobia, Rachycentron canadum, is an important species for aquaculture worldwide.
- Production technology from egg to market was established in the early 1990s and continues to be perfected today.
- This species exhibits extraordinary growth potential and can reach between 4 and 8 kg in 1 year, with females growing almost twice as fast and large as males.
- Despite continuous progress in maturation, spawning, larval rearing, fingerling production, nutrition, health management, genetics, and grow-out technology, overall cobia aquaculture production worldwide has been slow in the last decade.
- One of the biggest challenges remains the development of practical commercial feeds that are ecologically and economically efficient for this species.
- Feed conversion ratios are still remarkably high, ranging from 2.0 to 3.0:1.
- In addition to nutritional challenges, diseases such as Photobacterium, Amyloodinium ocellatus, and Brooklynella hostilis continue to impact cobia aquaculture production worldwide.
- Genetics and breeding programs for cobia are still in their infancy.
- Nutrition, health, and genetics will be the greatest drivers of improving overall performance and increasing production in the cobia aquaculture industry.
- Source: https://doi.org/10.1111/jwas.12810.
Let Us Start Our Modeling Effort!
- U.S. commercial landings and dockside values since 1950 were compiled from NOAA Fisheries (https://www.fisheries.noaa.gov/foss/).
- Major producing states were identified, and shifts in landings were measured. Nominal dockside prices ($/lb) are imputed from commercial landings (lb/yr) and dockside values ($/yr).
- Empirical commercial landings models were developed, identifying significant determinants.
- Retail prices compiled from Urner Barry Comtell (https://www.comtell.com/) were compared by major categories.
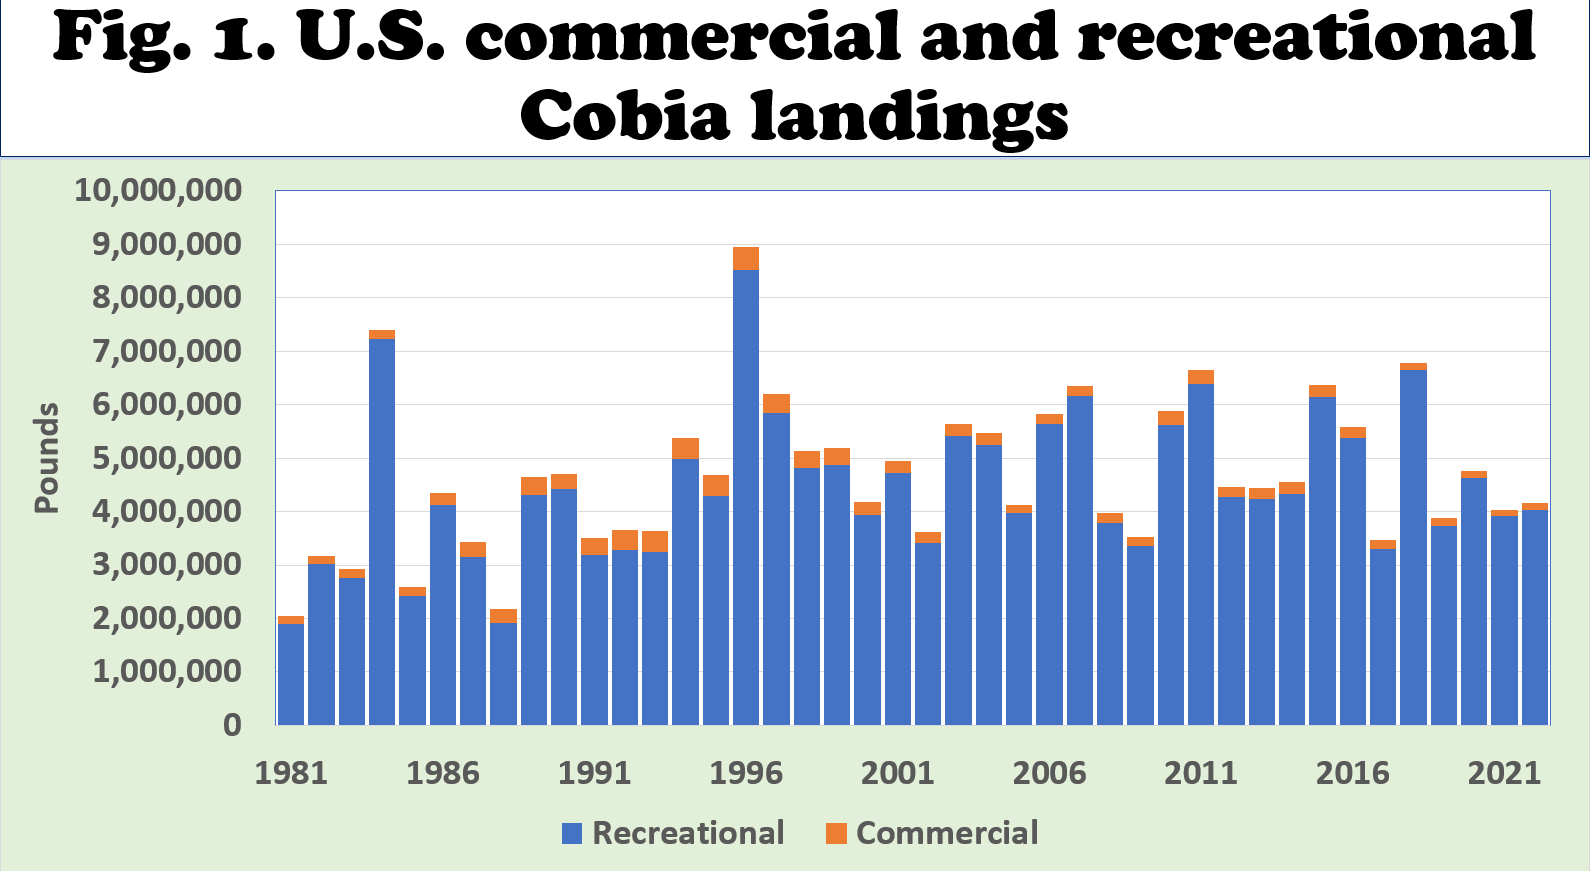
U.S. Commercial and Recreational Cobia Landings
- In Fig. 1, NOAA Fisheries data show commercial and recreational landings of Cobia in the U.S. since 1981.
- Combined landings peaked in 1996 at almost nine million pounds.
- Recreational landings contributed to an average of 96% of total landings since 2000.
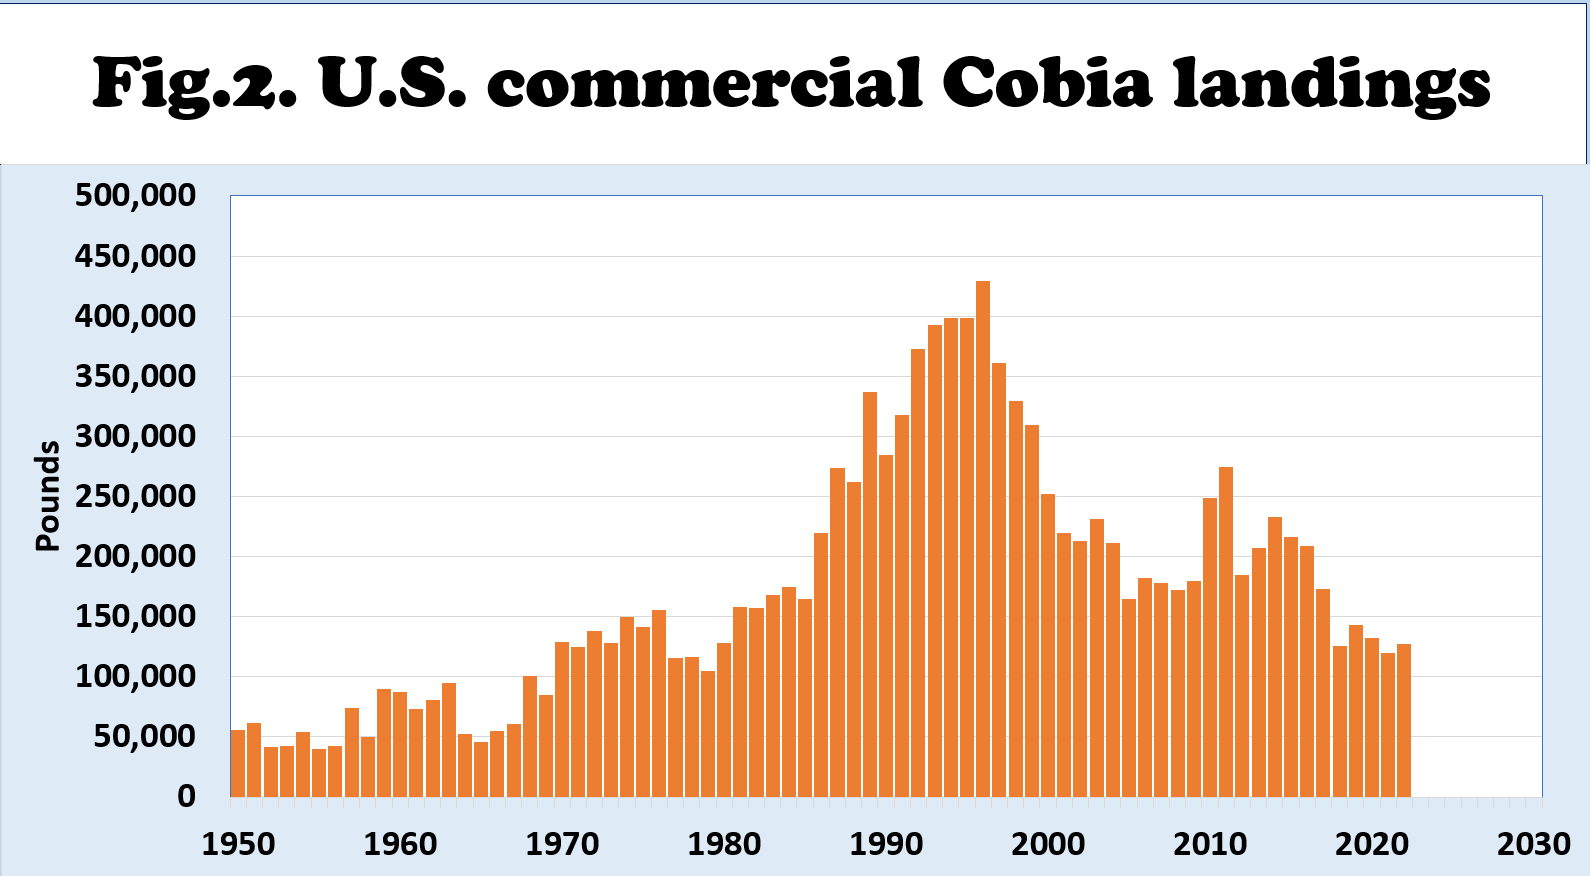
U.S. Commercial Cobia Landings
- Fig. 2 shows NOAA Fisheries data on commercial landings of Cobia in the U.S. since 1950.
- Commercial landings peaked in 1996 at almost 430,000 pounds.
- Commercial landings contributed an average of four percent of total landings since 2000.
- Since 2010, commercial landings have continued to fall, averaging 180,000 pounds annually.
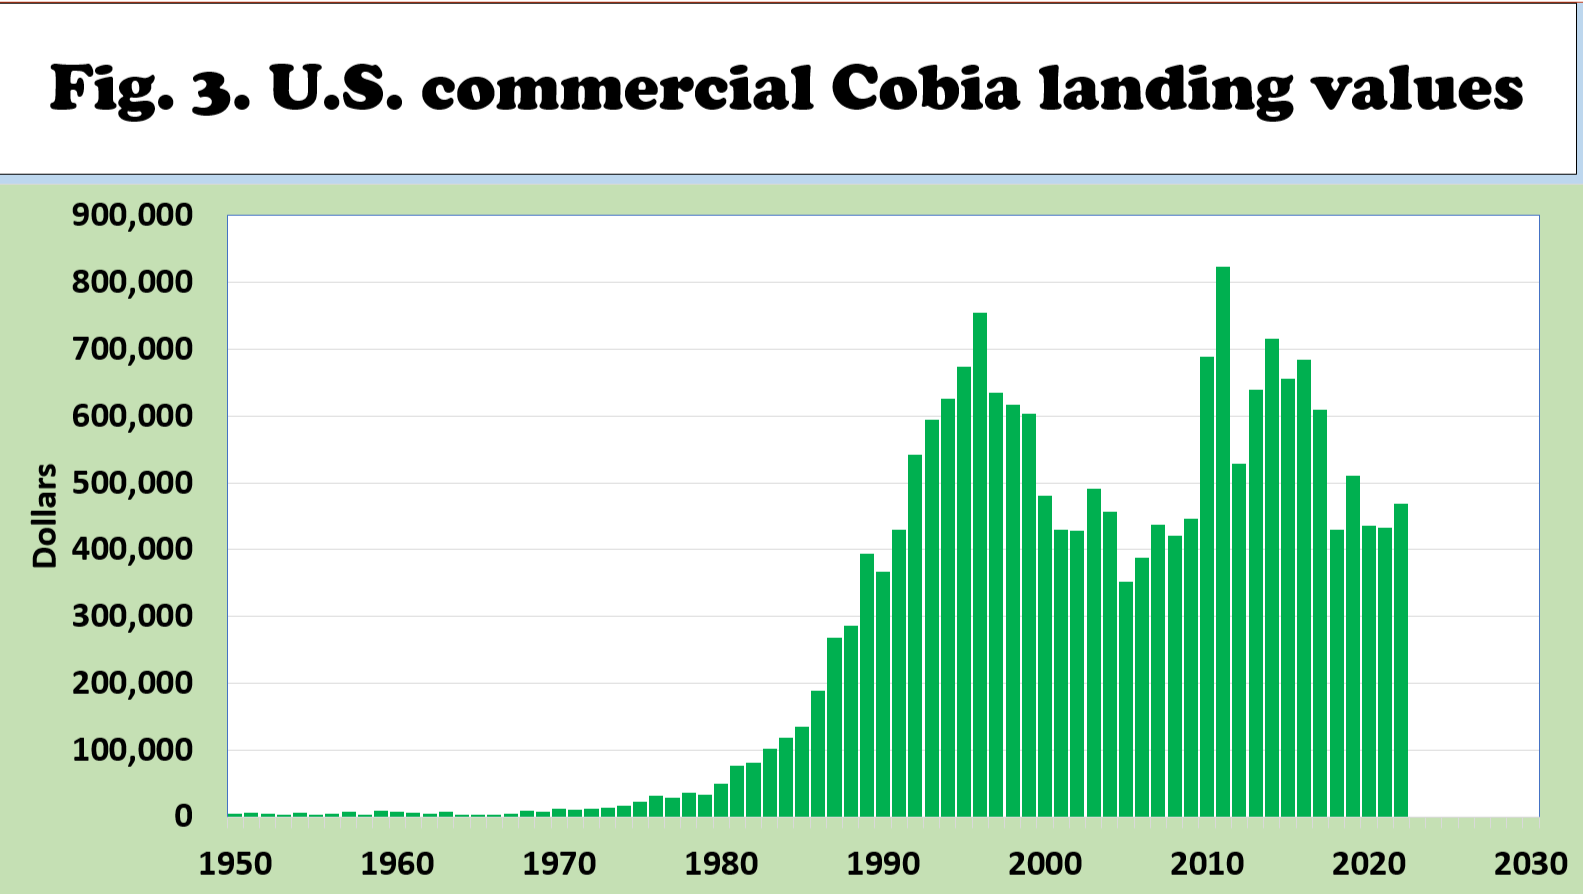
U.S. Commercial Cobia Landing Values
- Fig. 3 shows NOAA Fisheries data on commercial landing values of Cobias in the U.S. since 1950.
- Commercial landing values peaked in 2011 at more than $820,000.
- Commercial landing values have averaged more than $580,000 since 2010.
U.S. Commercial Cobia Landings by State
- Fig. 4 shows the major producing states from 2010 to 2022, including Florida's East Coast, Florida's West Coast, North Carolina, Louisiana, and Virginia.
- Limited landings were reported in Alabama, Texas, Rhode Island, and South Carolina.
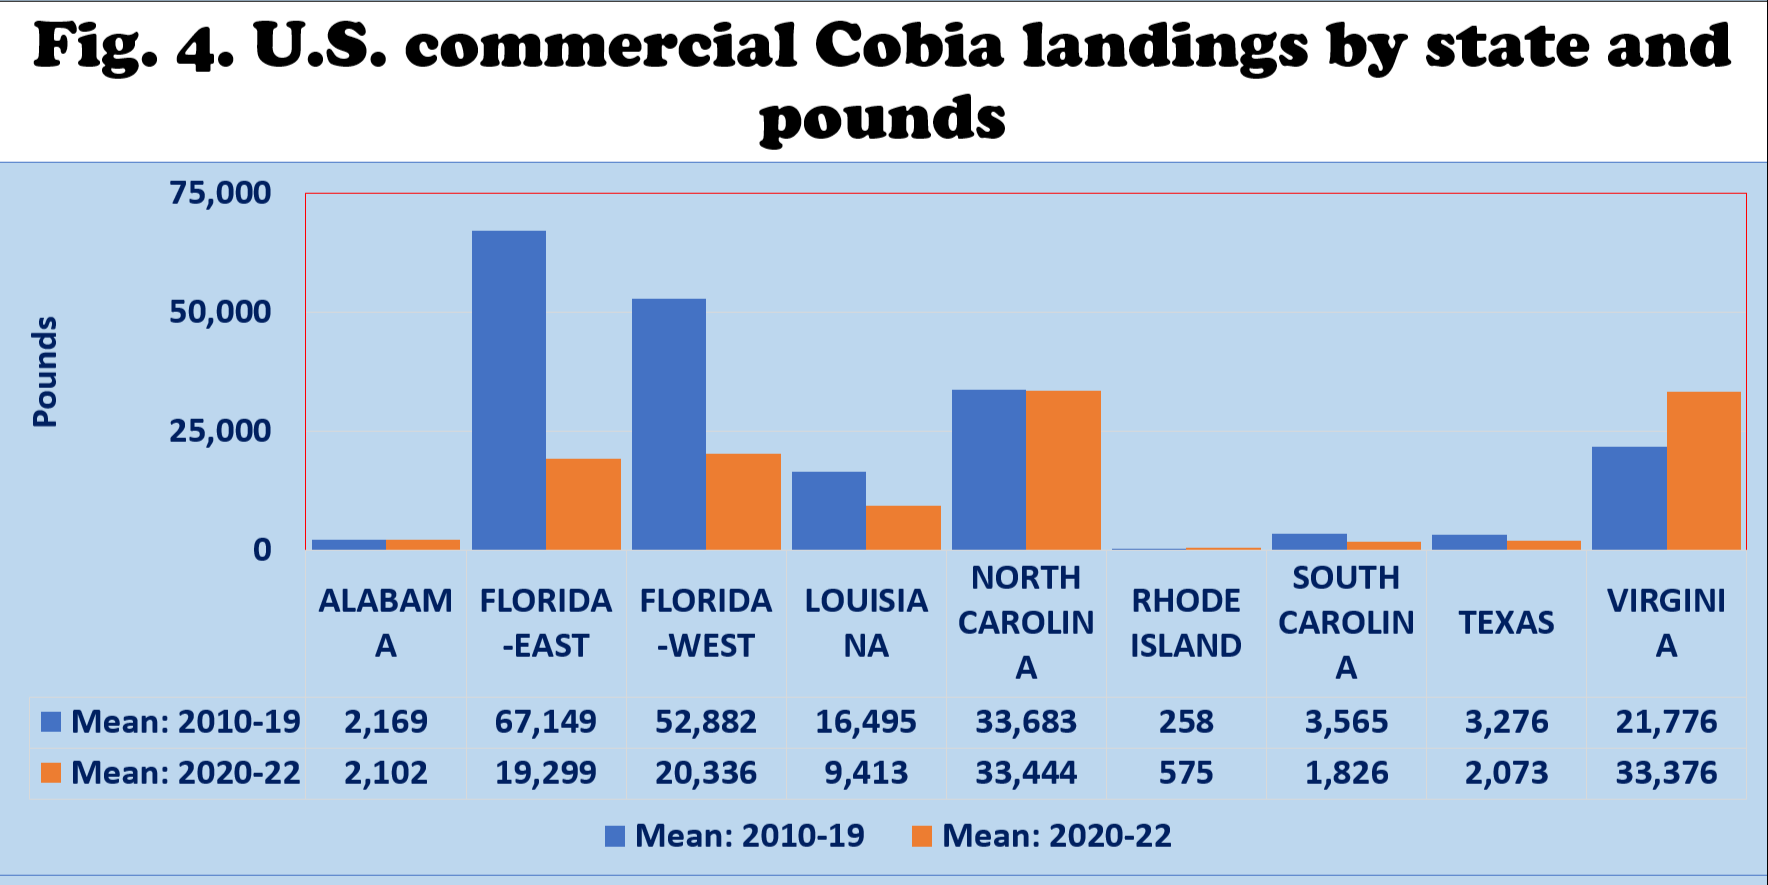
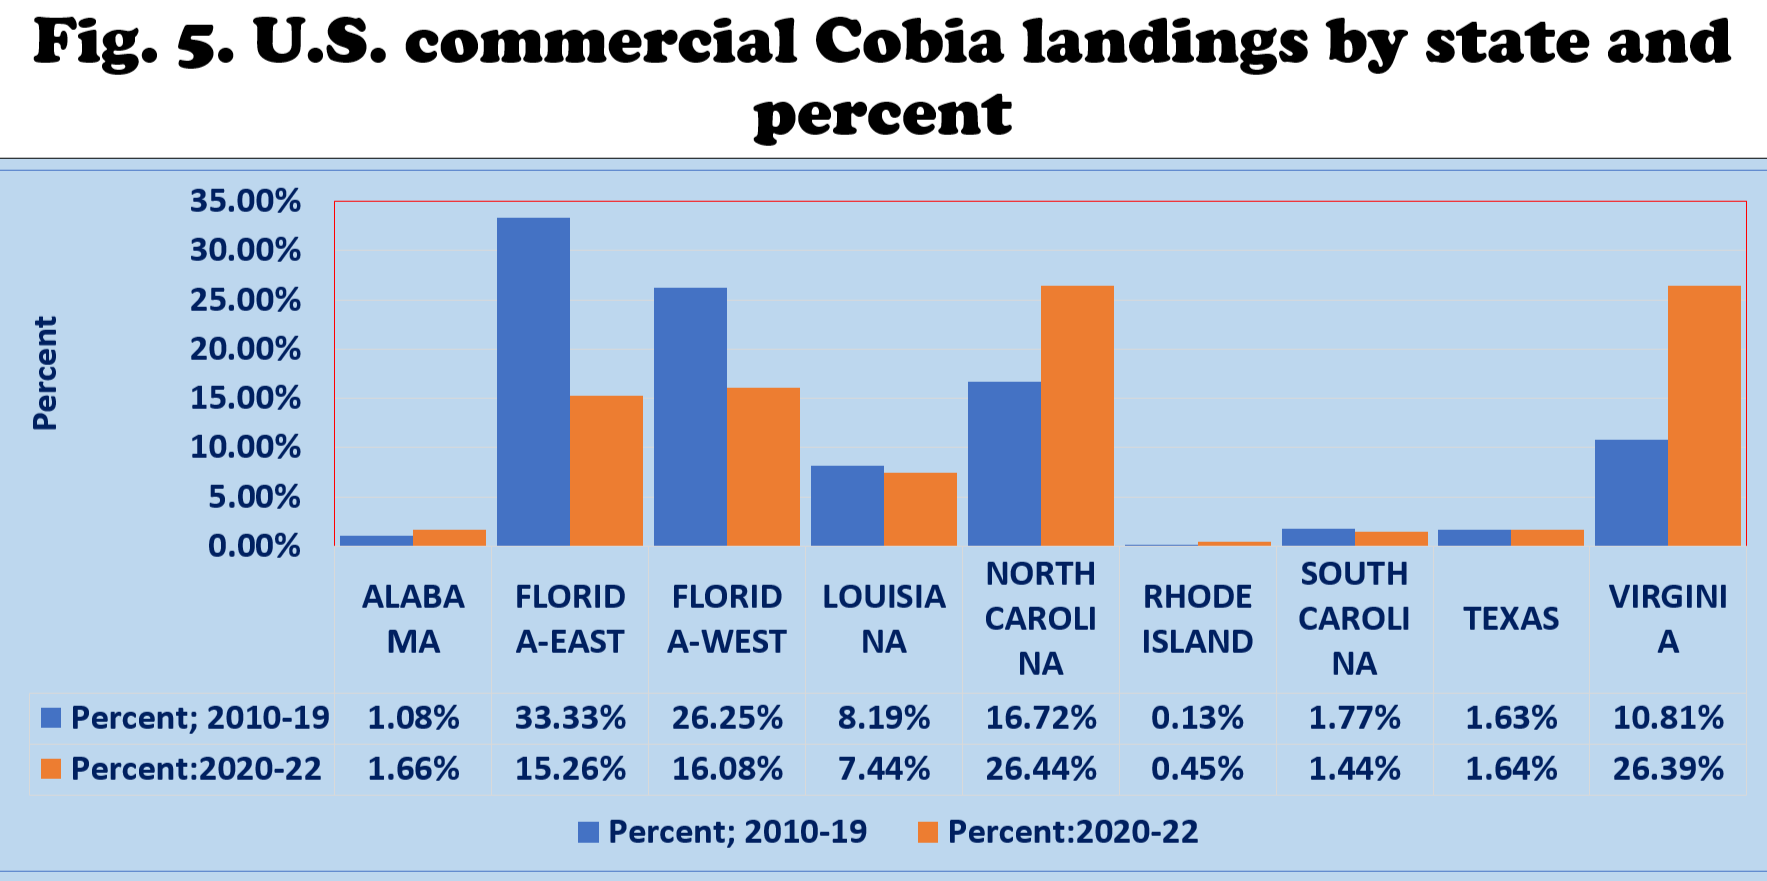
U.S. Atlantic Region Commercial Cobia Landings
- As Fig. 4 and 5 show, the Florida East Coast produced 67,000 lb/yr from 2010 to 2019. Its share of total U.S. commercial landings fell from 33% in 2010-19 to 15% in2020-22.
- Virginia landed 21,000 lb/yr in 2010-19. Its share of total U.S. commercial landings rose from 11% in 2010-19 to 26% in 2020-22.
- North Carolina landed 33,000 lb/yr in 2010-19. Its share of total U.S. commercial landings rose from 17% in 2010-19 to 26% in 2020-22.
U.S. Gulf of Mexico Region Commercial Cobia Landings
- As Fig. 4 and 5 show, Florida’s West coast produced 52,000 lb/yr from 2010-2019. Its share of total U.S. commercial landings fell from 26% in 2010-19 2010 to 15% in 2020-22.
- Louisiana landed 16,000 lb/yr from 2010-2019. Its share of total U.S. commercial landings fell from 8% in 2010-19 to 7% in 2020-22.
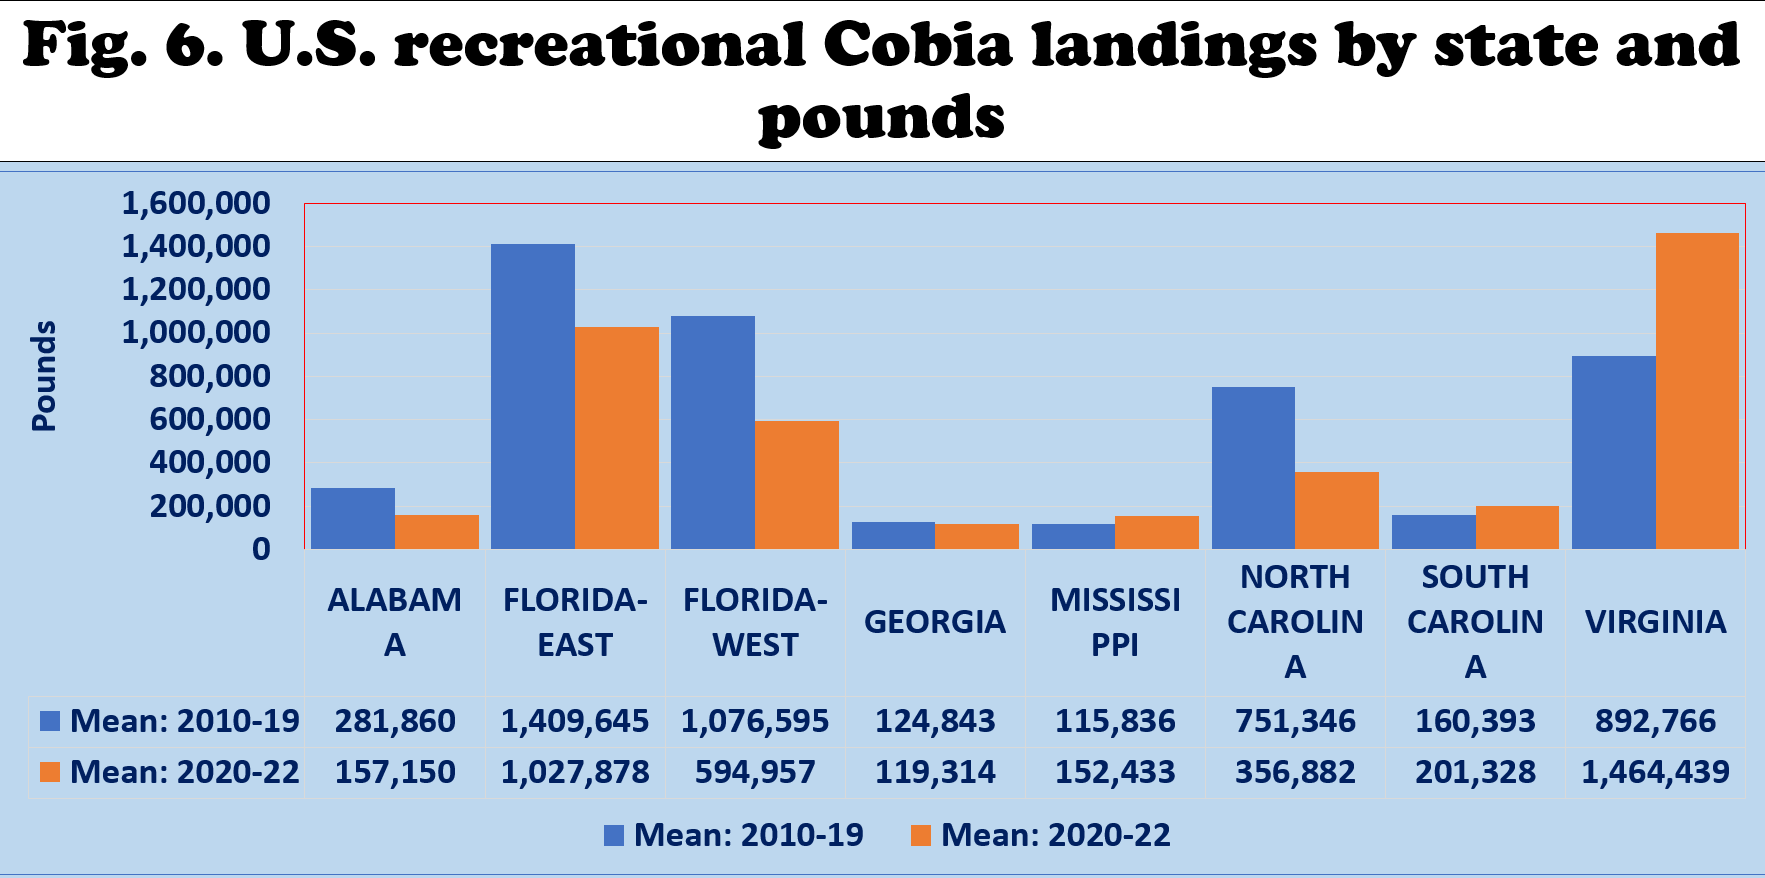
U.S. Commercial Cobia Landings by State
- Fig. 6 shows the major producing states from 2010 to 2022, including Florida's East Coast, Florida's West Coast, North Carolina, and Virginia.
- Limited recreational landings were reported in Alabama, Georgia, Mississippi, and South Carolina.
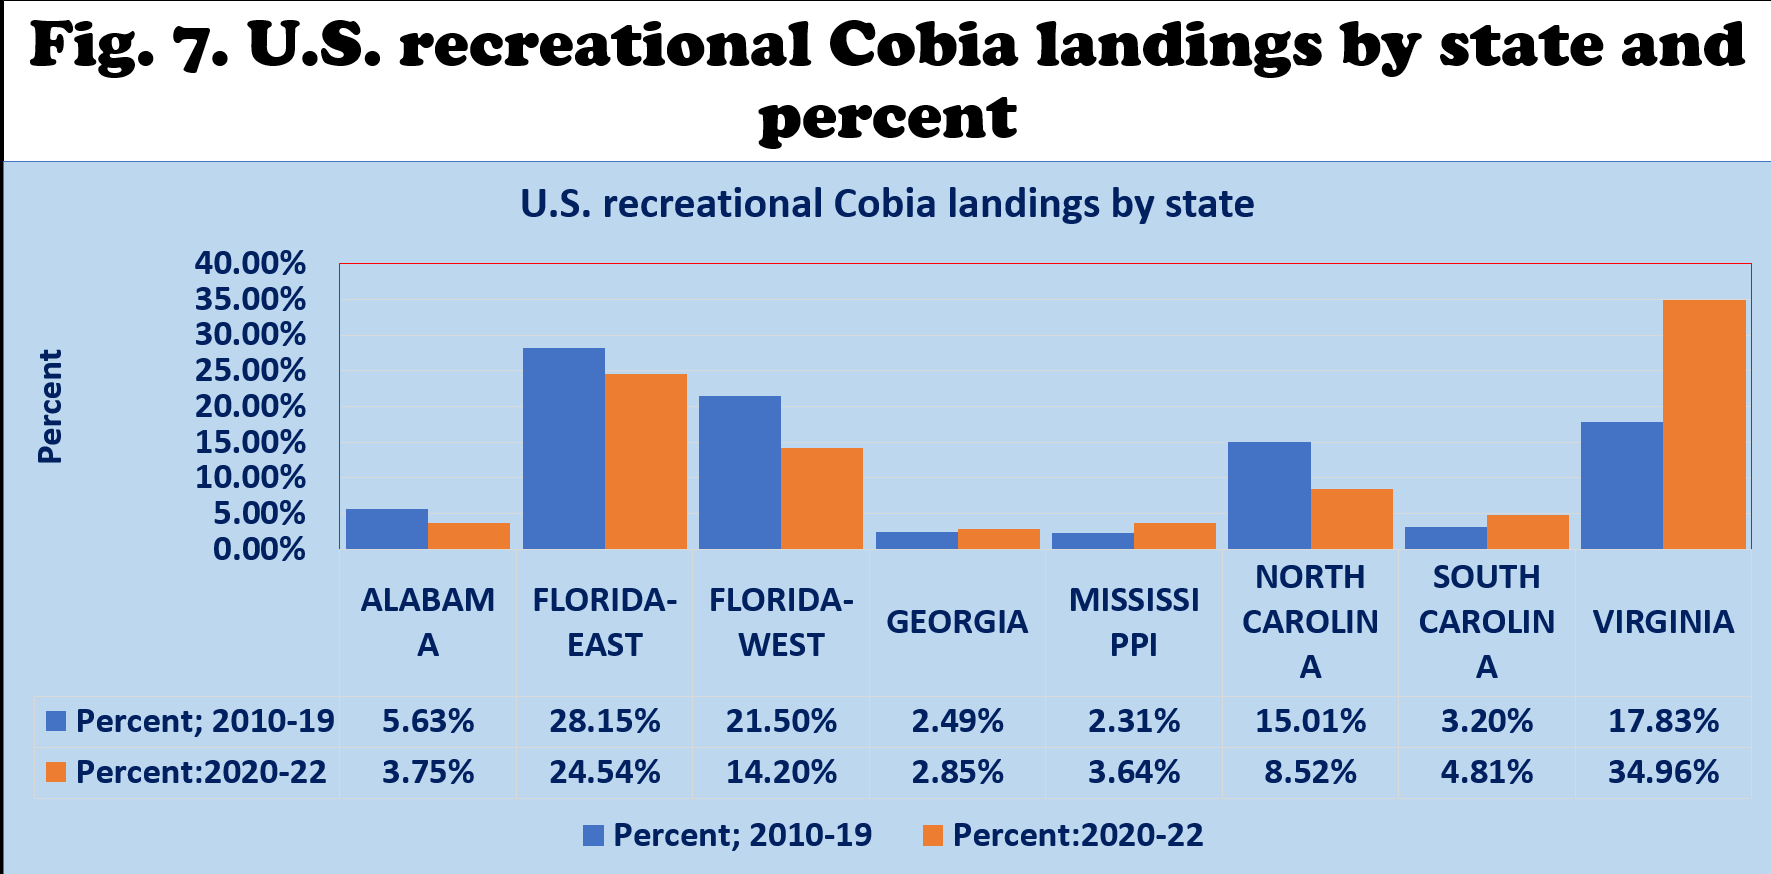
U.S. Atlantic Region Recreational Cobia Landings
- As Fig. 6 and 7 show, the Florida East Coast produced 1.4 million pounds from 2010 to 2019. Its share of total U.S. recreational landings fell from 28% in 2010-19 to 24% in 2020-22.
- Virginia landed 890,000 lb/yr in 2010-19. Its share of total U.S. recreational landings rose from 18% in 2010-19 to 35% in 2020-22.
- North Carolina landed 750,000 lb/yr in 2010-19. Its share of total U.S. recreational landings fell from 15% in 2010-19 to 8% in 2020-22.
U.S. Gulf of Mexico Region Recreational Cobia Landings
- As Fig. 6 and 7 show, the Florida West Coast produced 1.1 million pounds from 2010 to 2019. Its share of total U.S. recreational landings fell from 21% in 2010-19 to 14% in 2020-22.
- Alabama landed 280,000 lb/yr in 2010-19. Its share of total U.S. recreational landings fell from 6% in 2010-19 to 4% in 2020-22.
- Mississippi landed 115,000 lb/yr in 2010-19. Its share of total U.S. recreational landings rose from 2% in 2010-19 to 4% in 2020-22.
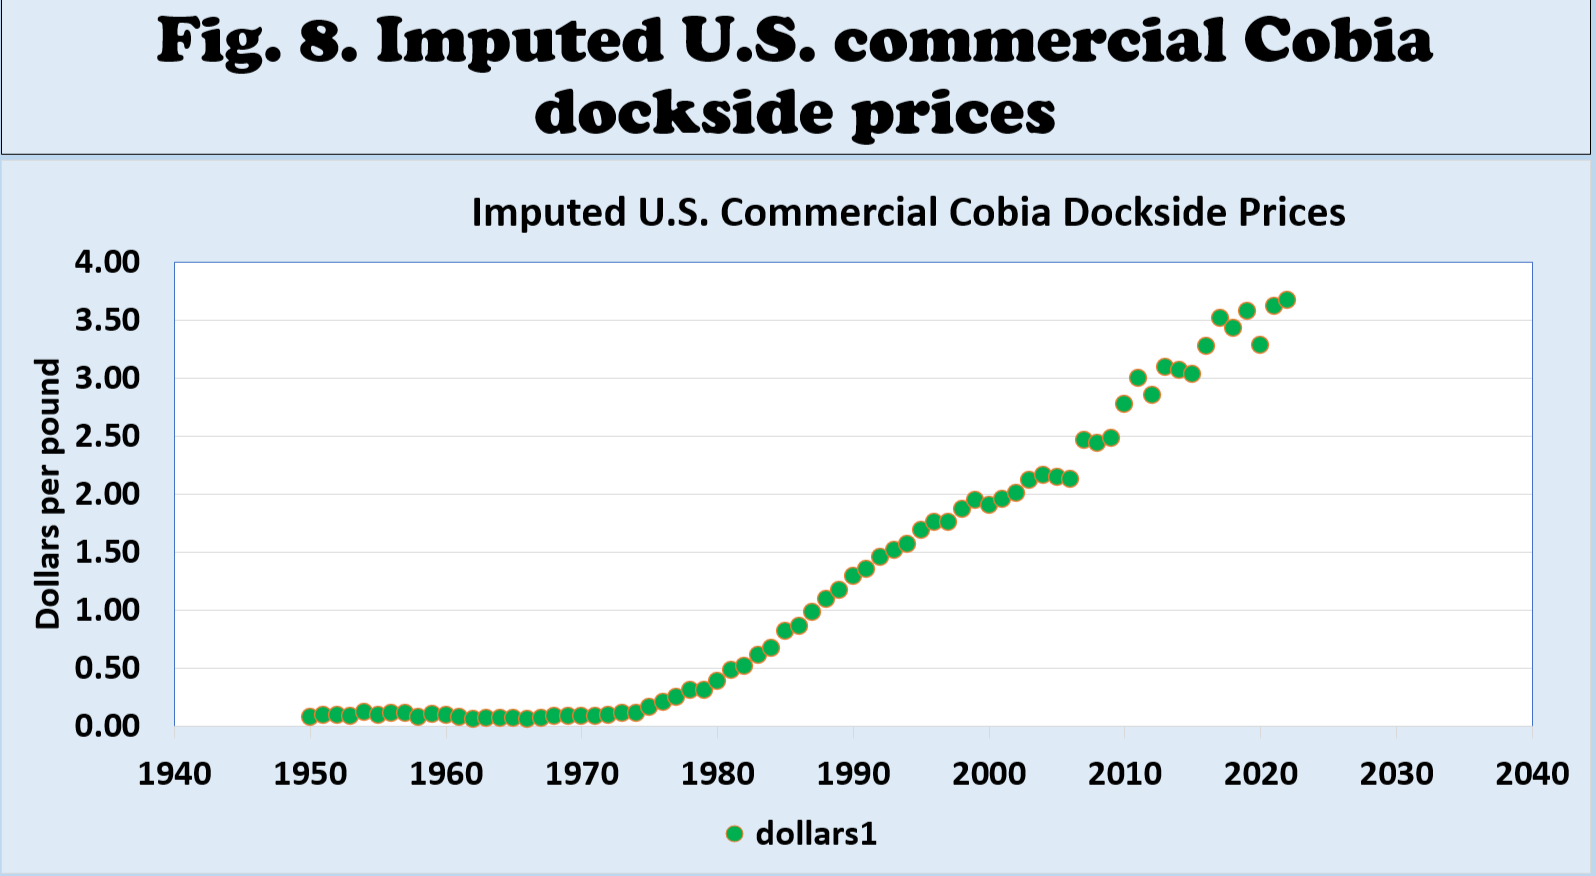
Imputed U.S. Commercial Cobia Dockside Prices
- The imputed dockside prices in the U.S. are shown in Fig. 8.
- U.S. dockside prices continued to rise and peaked in 2022 at $3.68 per pound.
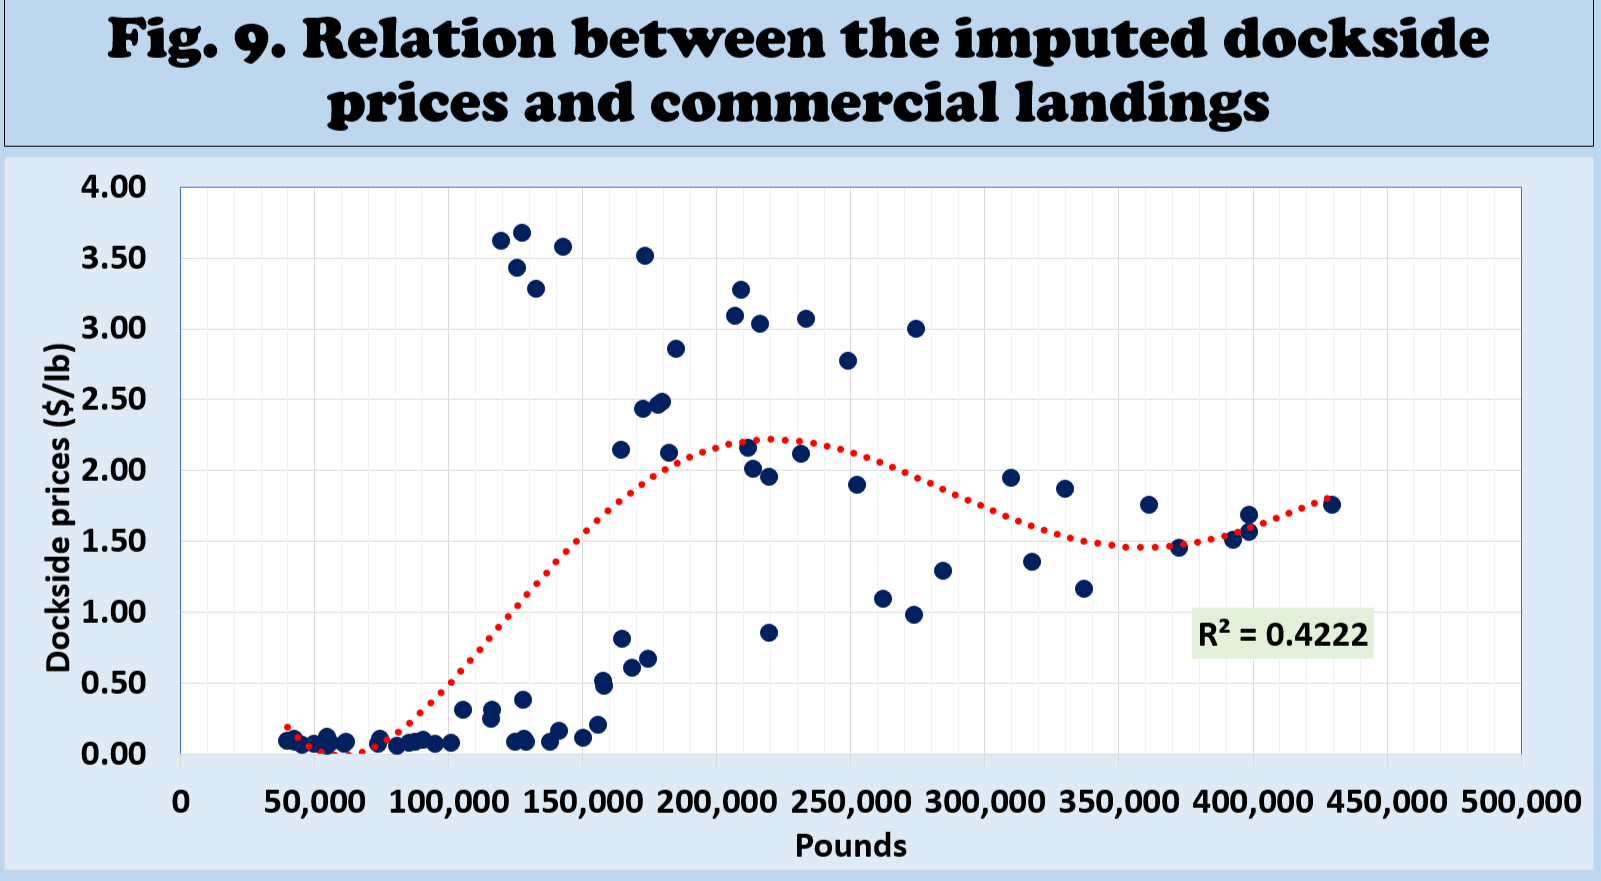
Imputed U.S. Commercial Cobia Dockside Prices and Commercial Landings
- Fig. 9 shows the empirical relationship between the imputed dockside prices and commercial landings in the U.S.
- The imputed dockside prices tended to rise at lower commercial landings.
- When commercial landings rose above 200,000 pounds, the imputed dockside prices flattened below $3.00 per pound.
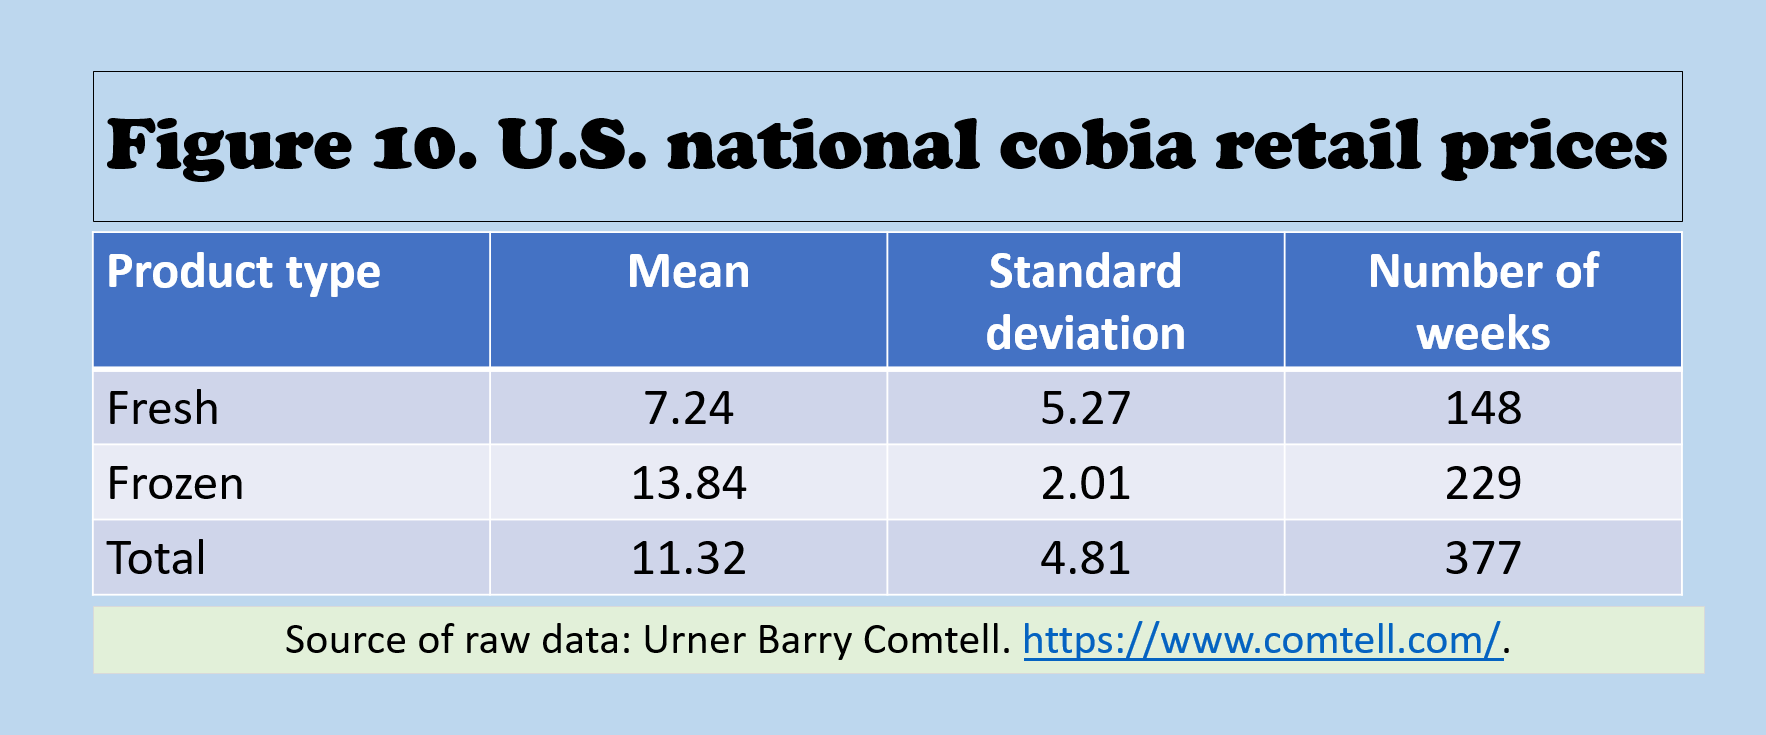
U.S. Retail Cobia Market
- Fig. 10 shows the average non-discounted retail prices of fresh and frozen cobia in the 26 locations Urner Barry Comtell (UBC) monitored.
- The U.S. retail prices compiled from UBC covered October 2019 to March 2024.
- There were wide fluctuations in cobia retail prices among the 26 locations and over time.
- The national average fresh cobia retail prices were significantly higher than the frozen cobia retail prices.
Marginal Effects on U.S. Cobia Commercial Landings
- A significant double-log regression equation was estimated with commercial landings as the dependent variable.
- The addition of diesel prices reduced the number of observations to 28, covering 1995 to 2022.
- The estimated equation explained 94% of the variations in commercial landings.
- Six independent variables significantly influenced commercial landings.
- U.S. commercial landings significantly decreased when diesel prices and per capita disposable income rose and during recessions.
- Significant increases in U.S. commercial landings were observed during higher recreational landings.
Summary, Limitations, and Implications
- Since 2010, U.S. Cobia commercial landings have averaged 184,000 pounds annually, contributing 4% of total landings.
- The major commercial-producing states of Cobia are Florida's East Coast, Florida's West Coast, North Carolina, Louisiana, and Virginia.
- Since 2010, U.S. Cobia recreational landings have averaged 4.8 million pounds annually, with recreational landings contributing 96%.
- Florida's East Coast, Florida's West Coast, North Carolina, and Virginia are the major recreational-producing states of cobia.
- The imputed U.S. dockside prices continued to rise and peaked in 2022 at $3.68 per pound.
- There were wide fluctuations in U.S. cobia retail prices among the 26 locations and over time.
- The national average fresh cobia retail prices were significantly higher than the frozen cobia retail prices.
- U.S. commercial landings significantly decreased when diesel prices and per capita disposable income rose and during recessions.
- Significant increases in U.S. commercial landings were observed during higher recreational landings.
For accessibility assistance please contact Ben Posadas at ben.posadas@msstate.edu


