
Vol. 15, No. 3 / The Demographic Profiles of Animal Production and Aquaculture Producers and Workers
March 4, 2025
ABSTRACT
- The demographics of the aquaculture sector need to be identified urgently. The demographics data source is Lightcast but there is no national data exclusively for aquaculture. As such, this presentation covers the demographics of the NAICS sector 112 Animal Production and Aquaculture.
- This newsletter summarizes the demographics of animal production and aquaculture workers and owners in the U.S., Gulf of Mexico, now America, and Mississippi in 2024.
- In addition, demographic data for the Maryland shellfish aquaculture industry in 2024 was added to this newsletter.
- Demographic profiles include distribution by gender, race or ethnic origin, and age group.
KEYWORDS
- Ranches, farms, and feedlots; animals or animal products; aquatic plants, animals, or their products; shellfish aquaculture.
METHODS
- NAICS Sector 112 – Industries in the Animal Production and Aquaculture subsector raise or fatten animals for the sale of animals or animal products and/or raise aquatic plants and animals in controlled or selected aquatic environments for the sale of aquatic plants, animals, or their products.
- The subsector includes establishments, such as ranches, farms, and feedlots, primarily engaged in keeping, grazing, breeding, or feeding animals.
- These animals are kept for the products they produce or for eventual sale.
- The animals are generally raised in various environments, from total confinement or captivity to feeding on an open-range pasture.
- Demographic profiles include distribution by gender, race or ethnic origin, and age group.
- The demographic data were compiled from the Lightcast website (https://lightcast.io/) in 2025.
- The demographic data for the Maryland shellfish aquaculture industry was collected during the needs assessment survey conducted by Dr. Matt Parker of the University of Maryland Extension.
ANIMAL PRODUCTION AND AQUACULTURE WORKERS AND OWNERS BY RACE
- Results indicate that most animal production and aquaculture workers and owners are White, followed by Hispanic or Latino, and Black or African American (Fig. 1).
- The percentages of White workers and owners in the entire USA are 77.1%, the Gulf of America States are 74.1%, and Mississippi is 86.1%.
- Hispanic or Latino workers and owners account for 14.6% of the USA's animal production and aquaculture workforce, 19.6% in the Gulf of America State, and 2.1% in Mississippi.
- The percentages of Black or African American animal production and aquaculture workers and owners are 2.8% in the USA, 2.6% in the Gulf of America States, and 10.1% in Mississippi.
ANIMAL PRODUCTION AND AQUACULTURE WORKERS AND OWNERS BY GENDER
- Results indicate that most animal production and aquaculture workers and owners are male (Fig. 2).
- The percentages of male animal production and aquaculture workers and owners in the entire USA are 74.3%, the Gulf of America States are 76.1%, and Mississippi is 71.2%.
- The percentages of female animal production and aquaculture workers and owners in the USA are 25.7%, the Gulf of America States are 23.9%, and Mississippi 28.8%.
ANIMAL PRODUCTION AND AQUACULTURE WORKERS AND OWNERS BY AGE GROUP
- Results indicate that the percentages of animal production and aquaculture workers and owners 65 years old and above are 20.3% in the entire USA, 22.8% in the Gulf of America States, and 9.2% in Mississippi (Fig. 3).
- The percentages of animal production and aquaculture workers and owners 55-64 years old are 20.0% in the entire USA, 20.1% in the Gulf of America States, and 21.5% in Mississippi.
- The 45-54-year-old animal production and aquaculture workers and owners comprise 15.9% in the USA, 18.8% in the Gulf of America States, and 13.2% in Mississippi.
- The 44-year-old and younger animal production and aquaculture workers and owners comprise 43.9% of the USA, 38.3% of the Gulf of America, and 56.1% of the Mississippi.
- The 35-44-year-old animal production and aquaculture workers and owners comprise 16.7% of the USA, 13.1% of the Gulf of America, and 17.2% of Mississippi.
- The 25-34-year-old animal production and aquaculture workers and owners comprise 16.7% of the USA, 16.4% of the Gulf of America, and 23.9% of the Mississippi.
- The rest are below 25 years old animal production and aquaculture workers and owners.
ANIMAL PRODUCTION AND AQUACULTURE WORKERS AND OWNERS' AVERAGE AGE
- The average age of animal production and aquaculture workers and owners is as follows: USA – 47.0 years old, Gulf of America States – 48.4 years old, and Mississippi – 42.6 years old (Fig. 4).
DEMOGRAPHIC DATA FOR THE MARYLAND SHELLFISH AQUACULTURE INDUSTRY
- The demographic data for the Maryland shellfish aquaculture industry was collected during the needs assessment survey conducted by Dr. Matt Parker of the University of Maryland Extension.
- Demographic profiles include distribution by education attainment, race or ethnic origin, and age group.
EDUCATION BREAKDOWN OF MARYLAND SHELLFISH AQUACULTURE
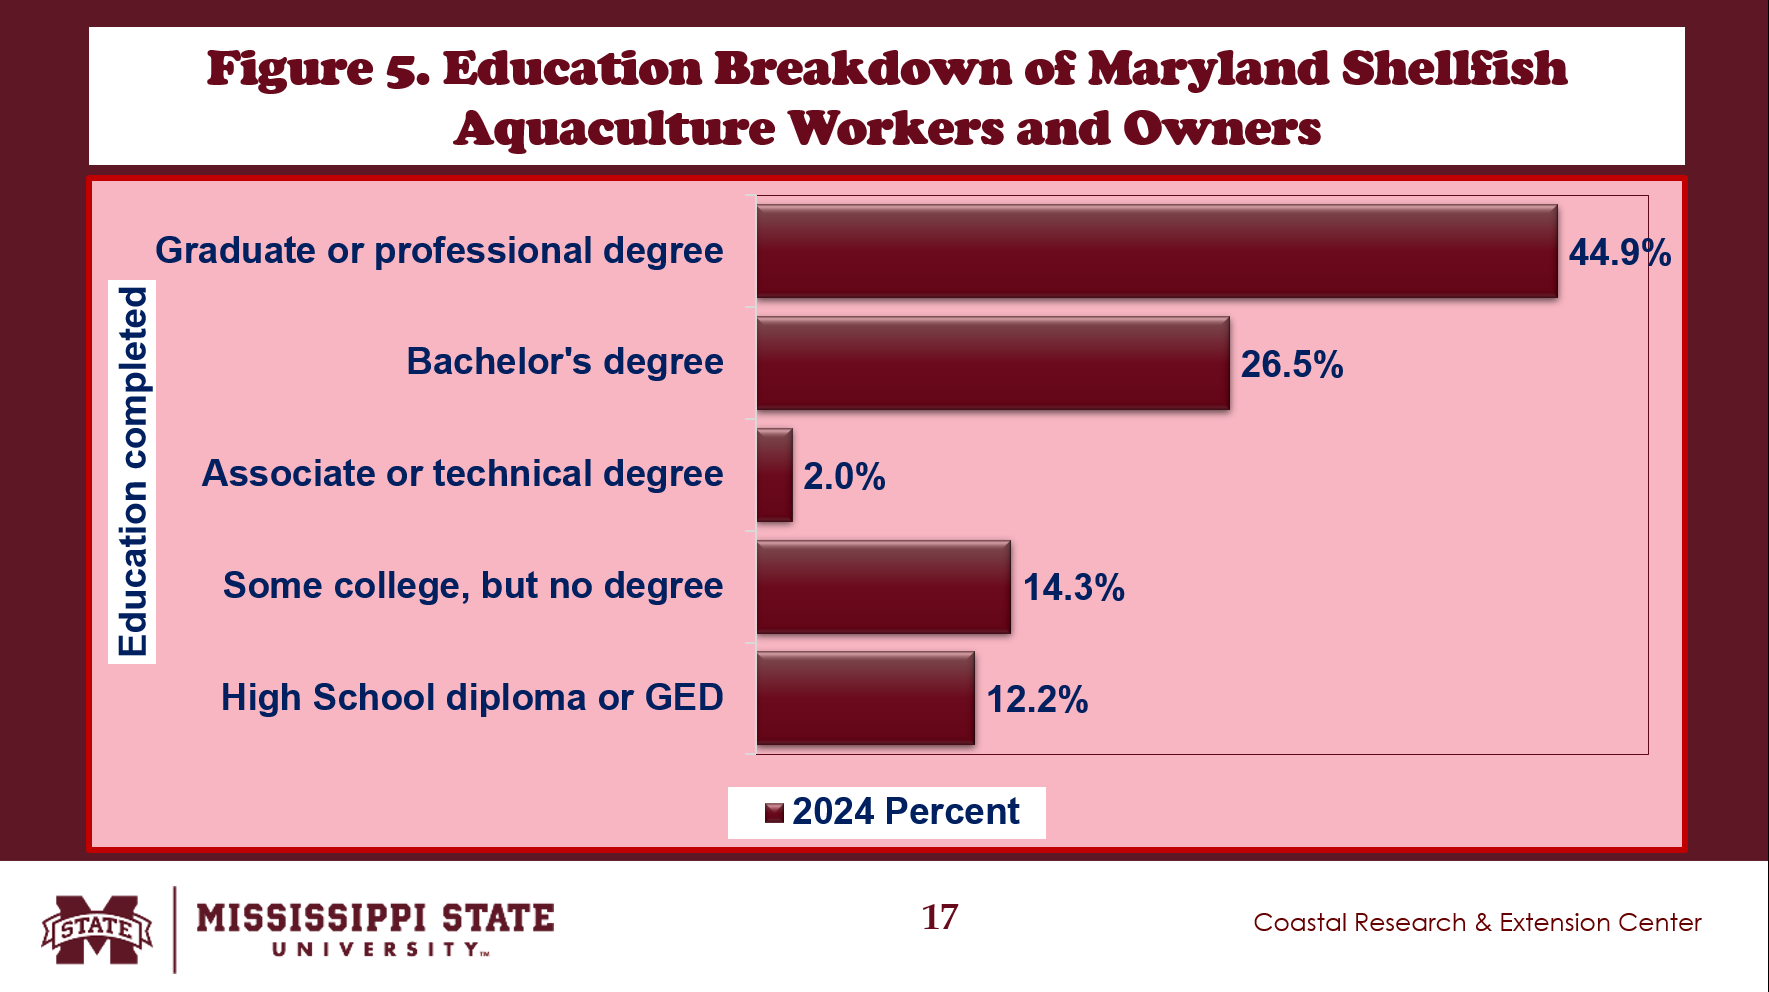
- The highest educational attainment of majority (44.9%) of the owners and workers of the Maryland shellfish aquaculture industry was graduate or professional degree (Fig. 5).
- About 26.5 percent completed bachelor degree.
- Those with associate or technical degree consisted of 2 percent while 14.3 percent finished some college, but no degrees.
- Approximately 12.2 percent earned high school diploma or General Educational Development (GED).
RACE OR ETHNICITY BREAKDOWN OF MARYLAND SHELLFISH AQUACULTURE
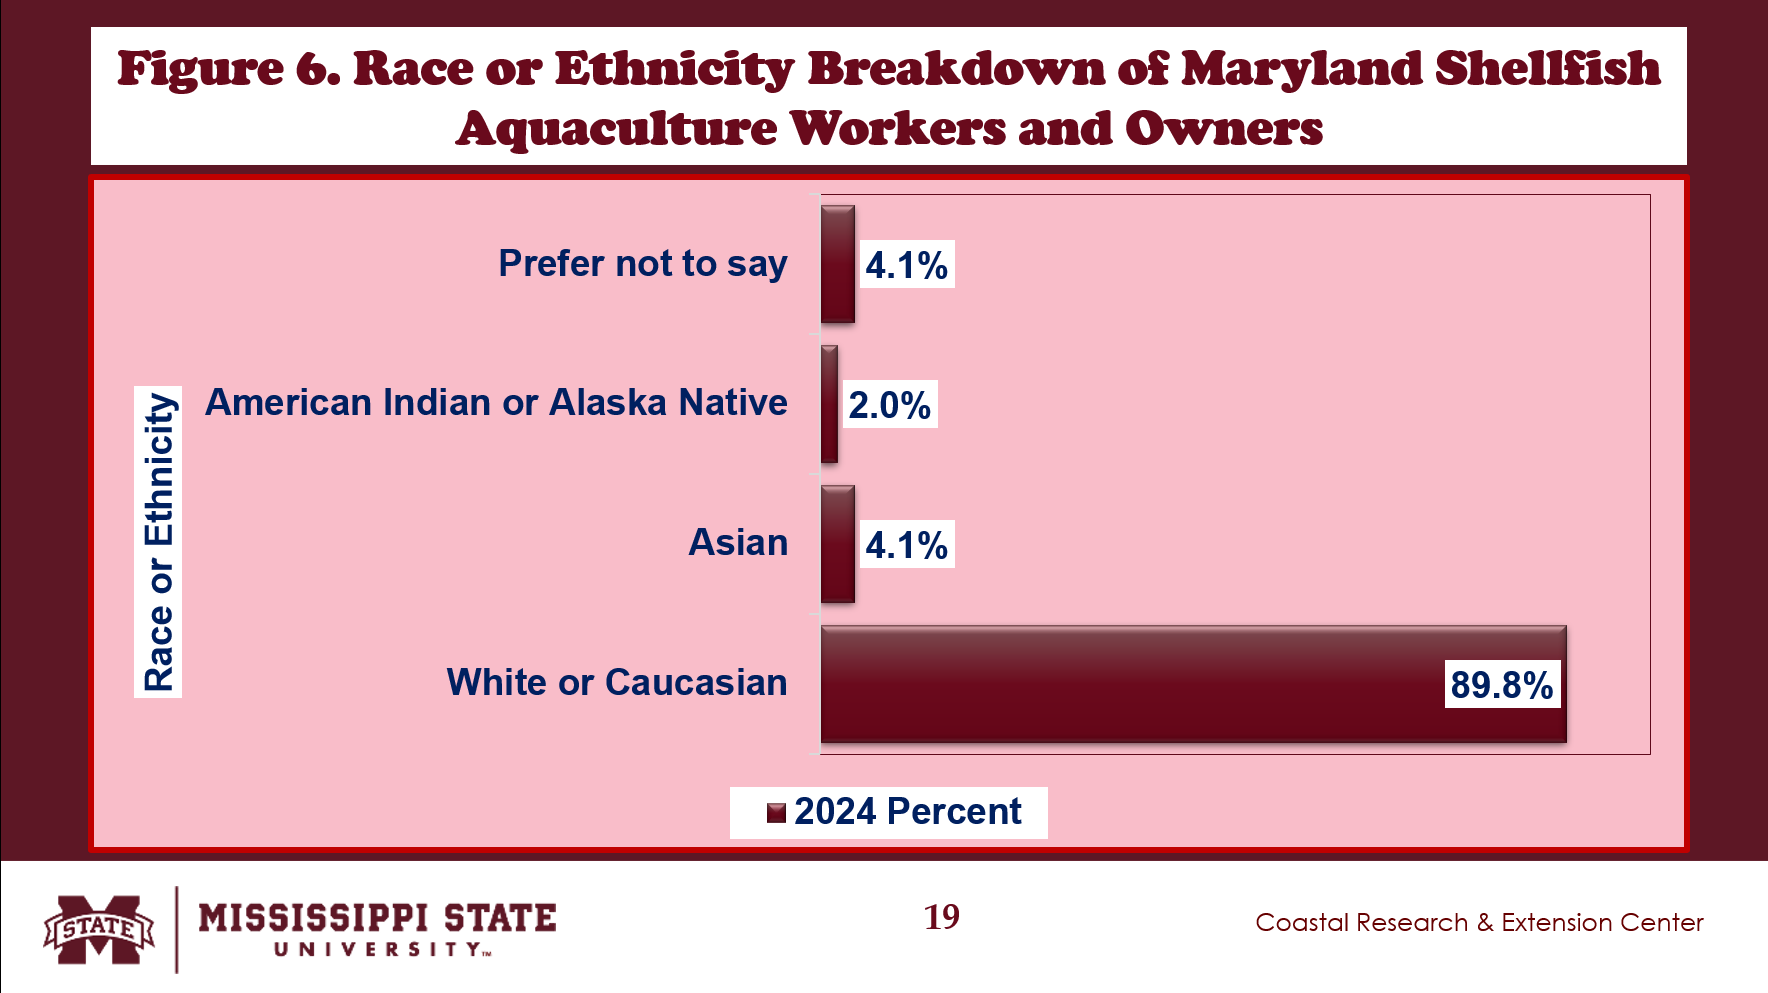
- Most of the owners and workers (89.8%) of the Maryland shellfish aquaculture industry were White or Caucasian (Fig. 6).
- Some were Asian (4.1%), and American Indian/Native American or Alaska Native (2.0%).
- About 4.1 percent preferred not to say.
AGE BREAKDOWN OF MARYLAND SHELLFISH AQUACULTURE
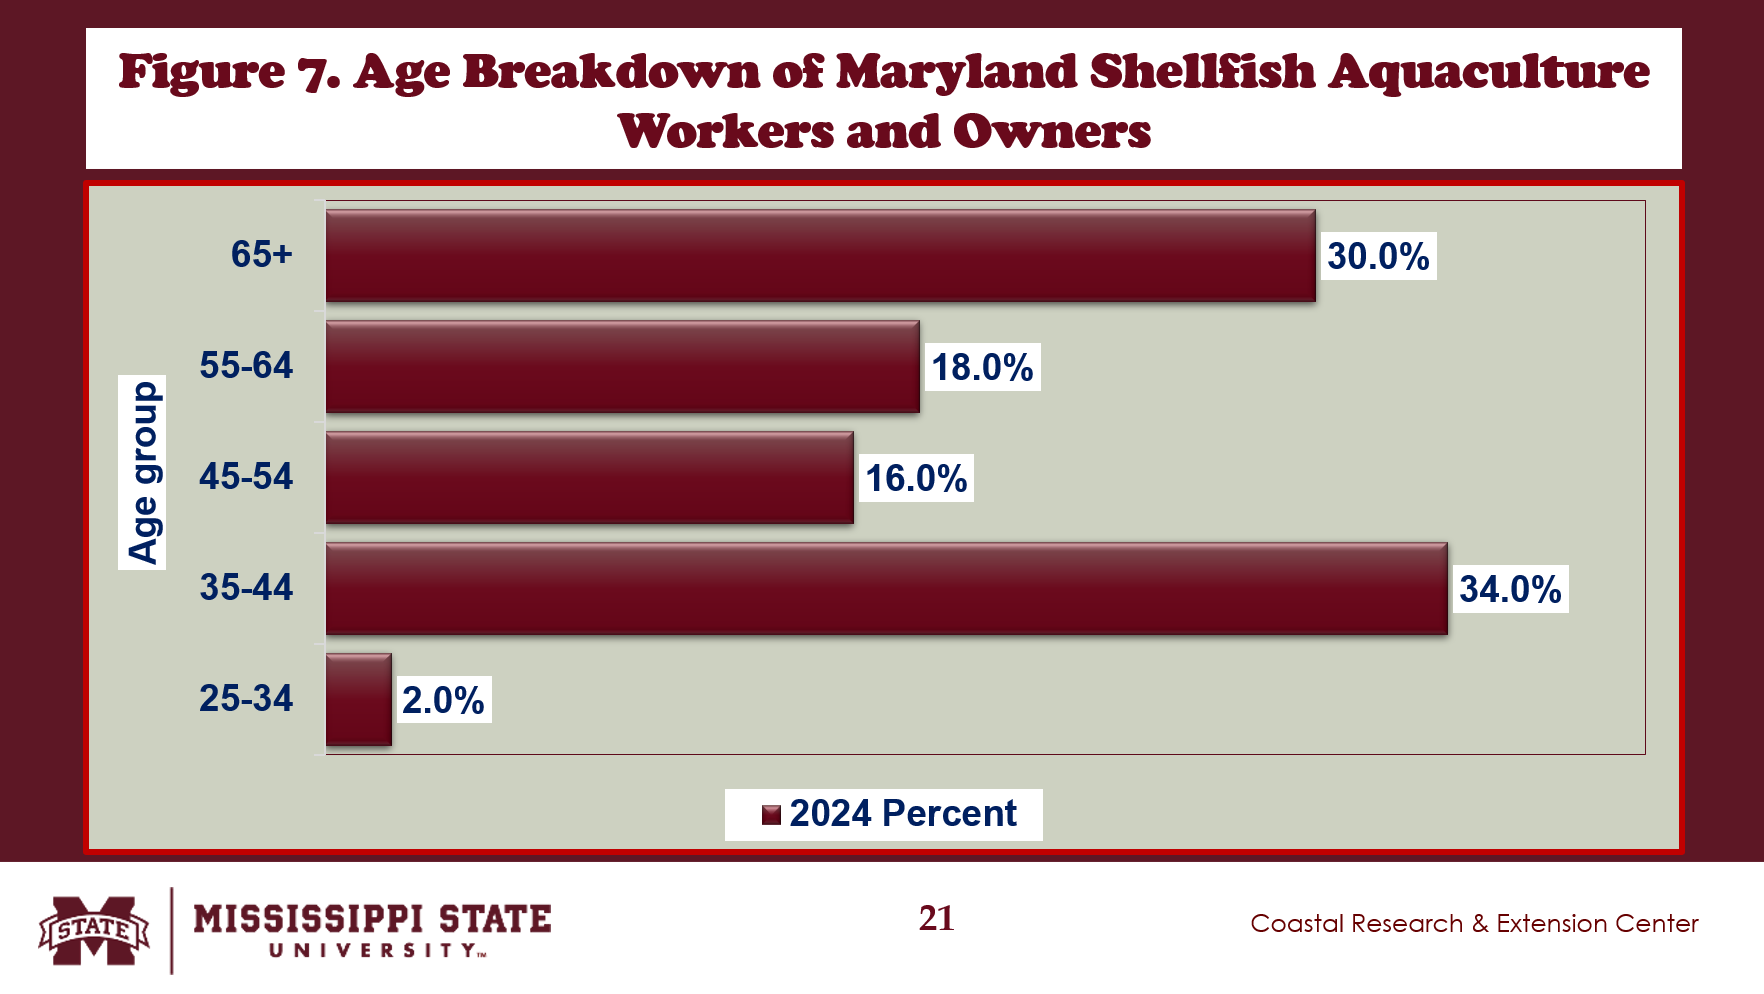
- Overall, the owners and workers of the Maryland shellfish aquaculture industry averaged about 52.9 years old.
- The 65-year-old and above owners and workers consisted of 30 percent of the Maryland shellfish aquaculture industry (Fig. 7).
- About 18 percent were between 55 and 64 years old.
- The 45-54 years old owners and workers added 16 percent.
- Approximately 34 percent were between 35 and 44 years old.
- The youngest age group added about two percent.
SUMMARY, LIMITATIONS, AND IMPLICATIONS
- There is a urgent need to identify the demographic characteristics of the aquaculture sector. However, there is no national demographic data exclusively for aquaculture.
- This newsletter provides detailed information about the demographic profiles of the animal production and aquaculture sector.
- Demographic profiles include covered gender, race or ethnic origin, and age group.
- The percentages of animal production and aquaculture workers and owners 65 years old and above are 20.3% in the entire USA, 22.8% in the Gulf of America States, and 9.2% in Mississippi.
- The average age of animal production and aquaculture workers and owners is as follows: USA – 47.0 years old, Gulf of America States – 48.4 years old, and Mississippi – 42.6 years old.
- The percentages of White workers and owners in the entire USA are 77.1%, the Gulf of America States are 74.1%, and Mississippi is 86.1%.
- The percentages of male animal production and aquaculture workers and owners in the entire USA are 74.3%, the Gulf of America States are 76.1%, and Mississippi is 71.2%.
- In addition, demographic data for the Maryland shellfish aquaculture industry in 2024 was added to this newsletter.
- The percentage of Maryland shellfish aquaculture workers and owners 65 years old and above was 30%.
- The average age of Maryland shellfish aquaculture workers and owners was 52.9 years old.
- Most of the workers and owners in the Maryland shellfish aquaculture were White or Caucasian.
- Majority workers and owners in Maryland shellfish aquaculture completed bachelor, graduate or professional degrees.
ACKNOWLEDGEMENT
- This newsletter is a contribution of the Mississippi Agricultural and Forestry Experiment Station and the Mississippi State University Extension Service. This material is based upon work that is supported in part by the National Institute of Food and Agriculture, U.S. Department of Agriculture, Hatch project under accession number 100004. Any opinions, findings, conclusions, or recommendations expressed in this publication are those of the author and should not be construed to represent any official USDA or U.S. Government determination or policy."
- This work was supported in part by the Mississippi-Alabama Sea Grant Consortium, National Oceanic and Atmospheric Administration, U.S. Department of Commerce, and the states of Alabama and Mississippi—federal grant number NA24OARX417C0155-T1-01. The statements, findings, conclusions, and recommendations are those of the authors and do not necessarily reflect the views of any of these funders.
SUGGESTED CITATION
- Posadas, B.C. 2025. The Demographic Profiles of Animal Production and Aquaculture Workers and Owners. Vol. 15, No. 3. Mississippi State University Extension and Mississippi-Alabama Sea Grant Publication MASGP-25-058-3. March 5, 2025. https://extension.msstate.edu/newsletters/mississippi-marketmaker.

Authors

Your Extension Experts


Related News
June 2, 1995
March 31, 1995